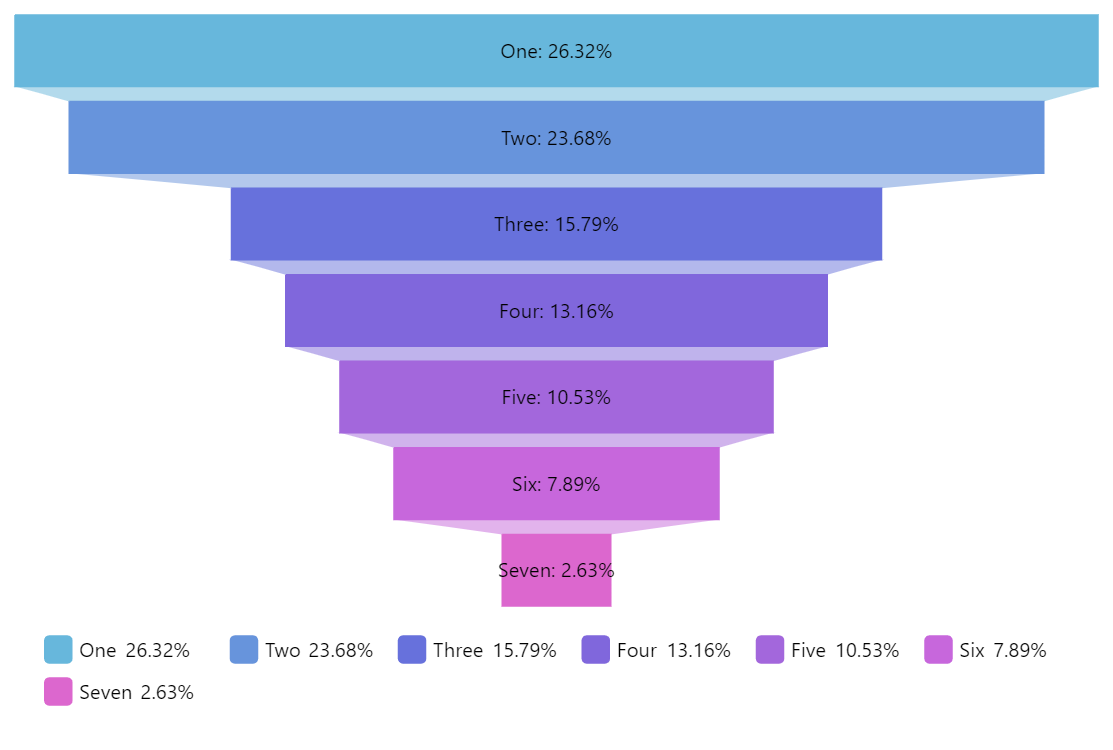
Funnel Chart
Funnel Chart is used to display how the data is filtered down through the steps of some process or processes. Each step represents a portion of the total going through it. The top (head) of each step represents the incoming value and the bottom (neck) the output value after some sort of filtering.
Related tutorials
Demo source