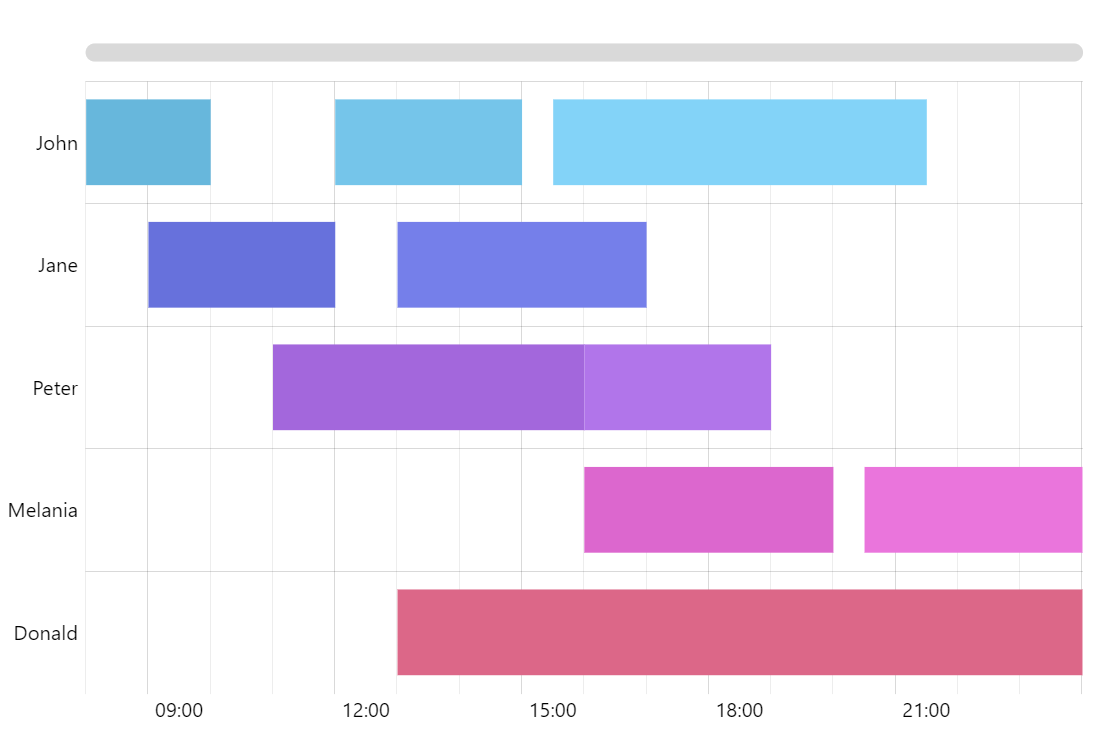
Gantt Chart
Gantt charts are typically used to display schedules or other time-based activities. In a nutshell, Gantt chart is a variation of a bar chart with time-based horizontal axis and bars starting at arbitrary values rather than on the axis.
Key implementation details
The only change needed to convert a regular bar chart with time-based values to a Gantt chart is changing its start values so bars don’t sart on the category axis, but rather on a specific value. We achieve this by setting openValueXField on the ColumnSeries.
Related tutorials
Demo source