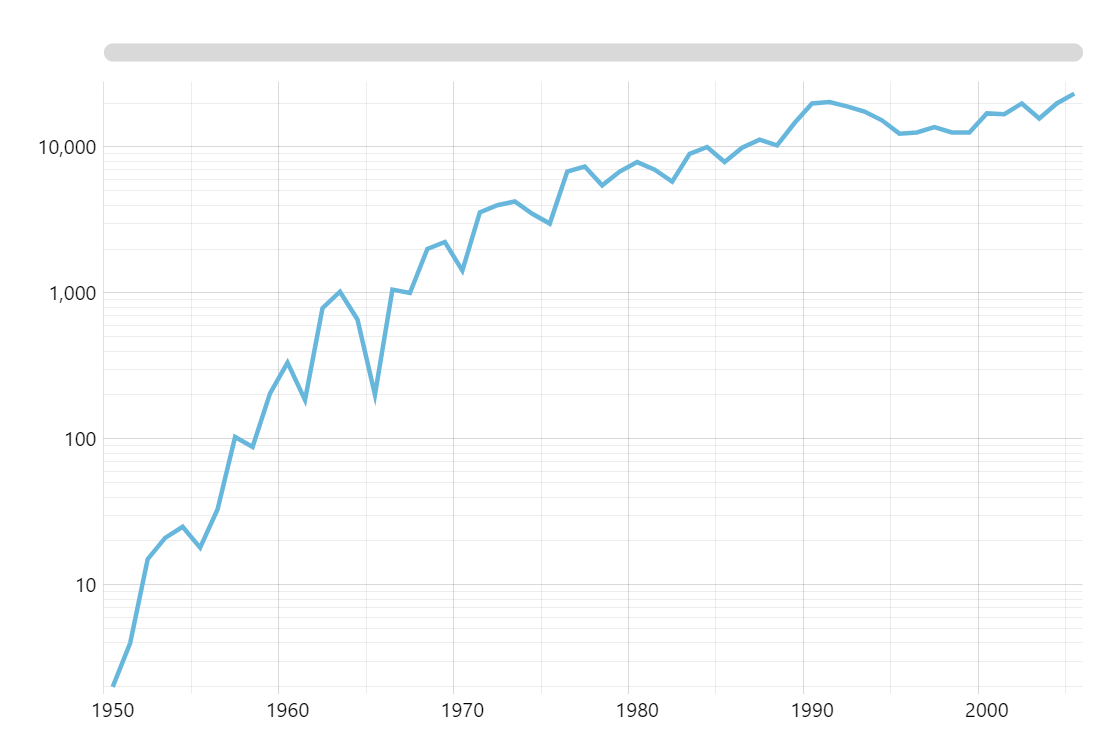
Logarithmic Scale
Displaying wide-ranging values on a regular (linear) scale makes charts unreadable. Switch your value axis to logarithmic scale and get back to highly useful data visualizations.
Key implementation details
All it takes is setting logarithmic: true on your ValueAxis.
Related tutorials
Demo source