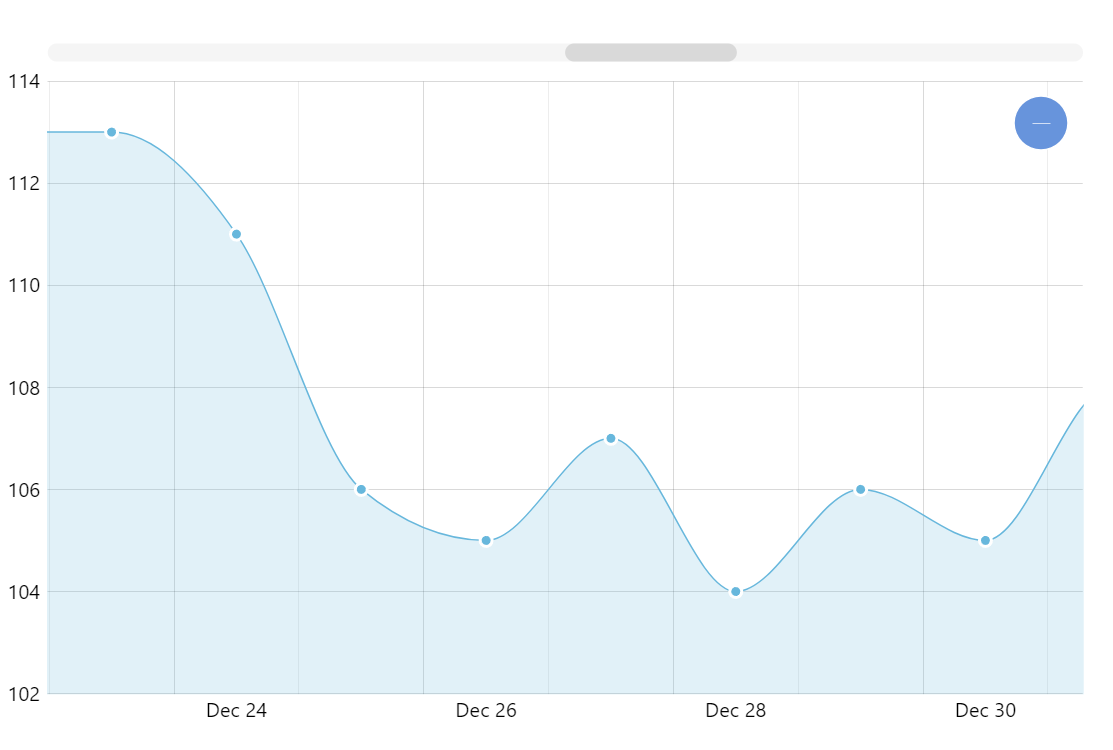
JavaScript Charts: Smoothed line chart
<script type="text/javascript">
var chart;
var graph;
// months in JS are zero-based, 0 means January
var chartData = [{
year: new Date(1950, 0),
value: -0.307
}, {
year: new Date(1951, 0),
value: -0.168
}, {
year: new Date(1952, 0),
value: -0.073
}, {
year: new Date(1953, 0),
value: -0.027
}, {
year: new Date(1954, 0),
value: -0.251
}, {
year: new Date(1955, 0),
value: -0.281
}, {
year: new Date(1956, 0),
value: -0.348
}, {
year: new Date(1957, 0),
value: -0.074
}, {
year: new Date(1958, 0),
value: -0.011
}, {
year: new Date(1959, 0),
value: -0.074
}, {
year: new Date(1960, 0),
value: -0.124
}, {
year: new Date(1961, 0),
value: -0.024
}, {
year: new Date(1962, 0),
value: -0.022
}, {
year: new Date(1963, 0),
value: 0.000
}, {
year: new Date(1964, 0),
value: -0.296
}, {
year: new Date(1965, 0),
value: -0.217
}, {
year: new Date(1966, 0),
value: -0.147
}, {
year: new Date(1967, 0),
value: -0.150
}, {
year: new Date(1968, 0),
value: -0.160
}, {
year: new Date(1969, 0),
value: -0.011
}, {
year: new Date(1970, 0),
value: -0.068
}, {
year: new Date(1971, 0),
value: -0.190
}, {
year: new Date(1972, 0),
value: -0.056
}, {
year: new Date(1973, 0),
value: 0.077
}, {
year: new Date(1974, 0),
value: -0.213
}, {
year: new Date(1975, 0),
value: -0.170
}, {
year: new Date(1976, 0),
value: -0.254
}, {
year: new Date(1977, 0),
value: 0.019
}, {
year: new Date(1978, 0),
value: -0.063
}, {
year: new Date(1979, 0),
value: 0.050
}, {
year: new Date(1980, 0),
value: 0.077
}, {
year: new Date(1981, 0),
value: 0.120
}, {
year: new Date(1982, 0),
value: 0.011
}, {
year: new Date(1983, 0),
value: 0.177
}, {
year: new Date(1984, 0),
value: -0.021
}, {
year: new Date(1985, 0),
value: -0.037
}, {
year: new Date(1986, 0),
value: 0.030
}, {
year: new Date(1987, 0),
value: 0.179
}, {
year: new Date(1988, 0),
value: 0.180
}, {
year: new Date(1989, 0),
value: 0.104
}, {
year: new Date(1990, 0),
value: 0.255
}, {
year: new Date(1991, 0),
value: 0.210
}, {
year: new Date(1992, 0),
value: 0.065
}, {
year: new Date(1993, 0),
value: 0.110
}, {
year: new Date(1994, 0),
value: 0.172
}, {
year: new Date(1995, 0),
value: 0.269
}, {
year: new Date(1996, 0),
value: 0.141
}, {
year: new Date(1997, 0),
value: 0.353
}, {
year: new Date(1998, 0),
value: 0.548
}, {
year: new Date(1999, 0),
value: 0.298
}, {
year: new Date(2000, 0),
value: 0.267
}, {
year: new Date(2001, 0),
value: 0.411
}, {
year: new Date(2002, 0),
value: 0.462
}, {
year: new Date(2003, 0),
value: 0.470
}, {
year: new Date(2004, 0),
value: 0.445
}, {
year: new Date(2005, 0),
value: 0.470
}];
AmCharts.ready(function () {
// SERIAL CHART
chart = new AmCharts.AmSerialChart();
chart.pathToImages = "/lib/samples/javascript/images/";
chart.panEventsEnabled = true;
chart.dataProvider = chartData;
chart.autoMargins = false;
chart.marginLeft = 0;
chart.marginTop = 0;
chart.marginBottom = 30;
chart.marginRight = 0;
chart.categoryField = "year";
chart.zoomOutButton = {
backgroundColor: "#000000",
backgroundAlpha: 0.15
};
// listen for "dataUpdated" event (fired when chart is inited) and call zoomChart method when it happens
chart.addListener("dataUpdated", zoomChart);
// AXES
// category
var categoryAxis = chart.categoryAxis;
categoryAxis.parseDates = true; // as our data is date-based, we set parseDates to true
categoryAxis.minPeriod = "YYYY"; // our data is yearly, so we set minPeriod to YYYY
categoryAxis.gridAlpha = 0;
// value
var valueAxis = new AmCharts.ValueAxis();
valueAxis.axisAlpha = 0;
valueAxis.inside = true;
valueAxis.gridAlpha = 0.1;
chart.addValueAxis(valueAxis);
// GRAPH
graph = new AmCharts.AmGraph();
graph.type = "smoothedLine"; // this line makes the graph smoothed line.
graph.lineColor = "#d1655d";
graph.negativeLineColor = "#637bb6"; // this line makes the graph to change color when it drops below 0
graph.bullet = "round";
graph.bulletSize = 5;
graph.lineThickness = 2;
graph.valueField = "value";
chart.addGraph(graph);
// CURSOR
var chartCursor = new AmCharts.ChartCursor();
chartCursor.cursorAlpha = 0;
chartCursor.cursorPosition = "mouse";
chartCursor.categoryBalloonDateFormat = "YYYY";
chart.addChartCursor(chartCursor);
// SCROLLBAR
var chartScrollbar = new AmCharts.ChartScrollbar();
chartScrollbar.graph = graph;
chartScrollbar.backgroundColor = "#DDDDDD";
chartScrollbar.scrollbarHeight = 30;
chartScrollbar.selectedBackgroundColor = "#FFFFFF";
chart.addChartScrollbar(chartScrollbar);
// WRITE
chart.write("chartdiv");
});
// this method is called when chart is first inited as we listen for "dataUpdated" event
function zoomChart() {
// different zoom methods can be used - zoomToIndexes, zoomToDates, zoomToCategoryValues
chart.zoomToDates(new Date(1972, 0), new Date(1984, 0));
}
</script>
<div id="chartdiv" style="width:100%; height:400px;"></div>
                    Smoothed line chart
|