Smoothed Line Chart
Line graph can be smoothed / rounded / curved to avoid jagged edges, especially if your data is very noisy. You can simply convert this smoothed-line graph to a smoothed-area graph by setting fill opacity of a graph to some bigger than zero value.
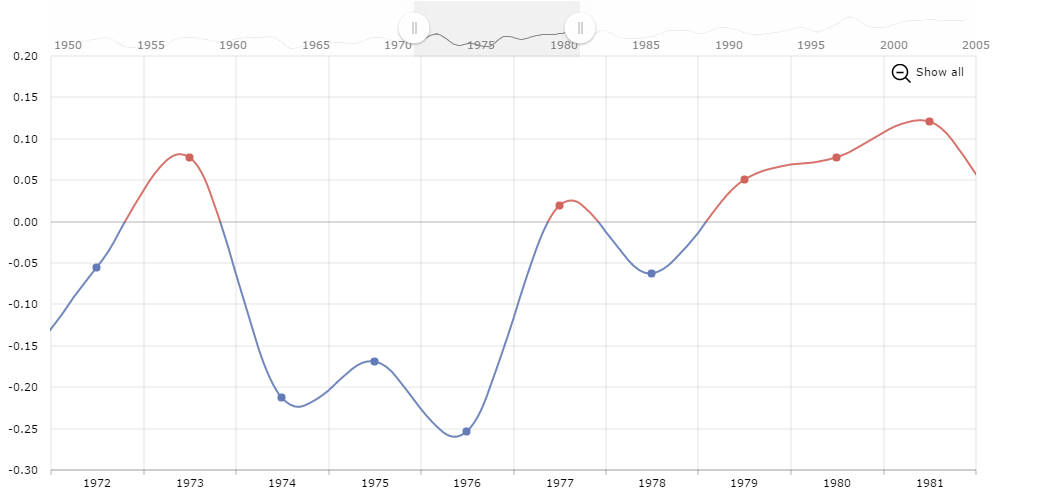
Line color changing at negative values
As you see, the line graph can use different color for it’s positive and negative part. And even more – line color can change at user defined value – you can set any negativeBase you want.
Demo source