Intro & Prerequisites
This tutorial is aimed to walk you through some easy steps to add charts and maps to your WIX.com website.
We assume that you already have fundamentals for amCharts products and are able to build a chart or map, either by coding it directly or using one of our online editing tools.
If you don't, you might want to start with these few introductory tutorials:
If you are really really allergic to coding, you might take a look at one of our visual editing tools:
- Live Editor for editing charts
- Pixel Map Generator for editing maps
Both of the above tools will generate a ready HTML/JavaScript code which you can simply grab and drop into your WIX website, as we will explain momentarily.
Alright, let's get on with it already
Preparing a chart
I'm going to start with a blank, single-page WIX website template.
As you may be already aware, a chart or map is just a bunch of HTML and JavaScript mixed together.
I'm going to start off with this, super-easy column chart:
See the Pen WIX chart by amCharts (@amcharts) on CodePen.24419
Click on the "HTML" tab to see the underlying code.
If you examine the code, you will see three required parts that comprise a chart:
- JavaScript Library includes (.js files): i.e.
<script ....> - An HTML container to place the chart in:
<div id="chartdiv" style="width: 100%; height: 100%;"></div> - JavaScript code for the chart:
<script>var chart = AmCharts.makeChart(....
Each of these are required. You might stumble upon various demos and examples in a number of places where those in different places. All of them need to be combined into a single block when adding to a WIX website.
A little note about the second part. Notice the style definition? The "width: 100%; height: 100%;" might not work well in other environments, but for a WIX website it makes total sense, because every page element is a sized box. Having it at 100% width and height will ensure that the chart or map will size to fit the box automatically, even as you resize it.
Adding the chart to WIX page
WIX has a perfect page element for our chart - an "HTML Code" box. You will find it under Add > More in page editor.
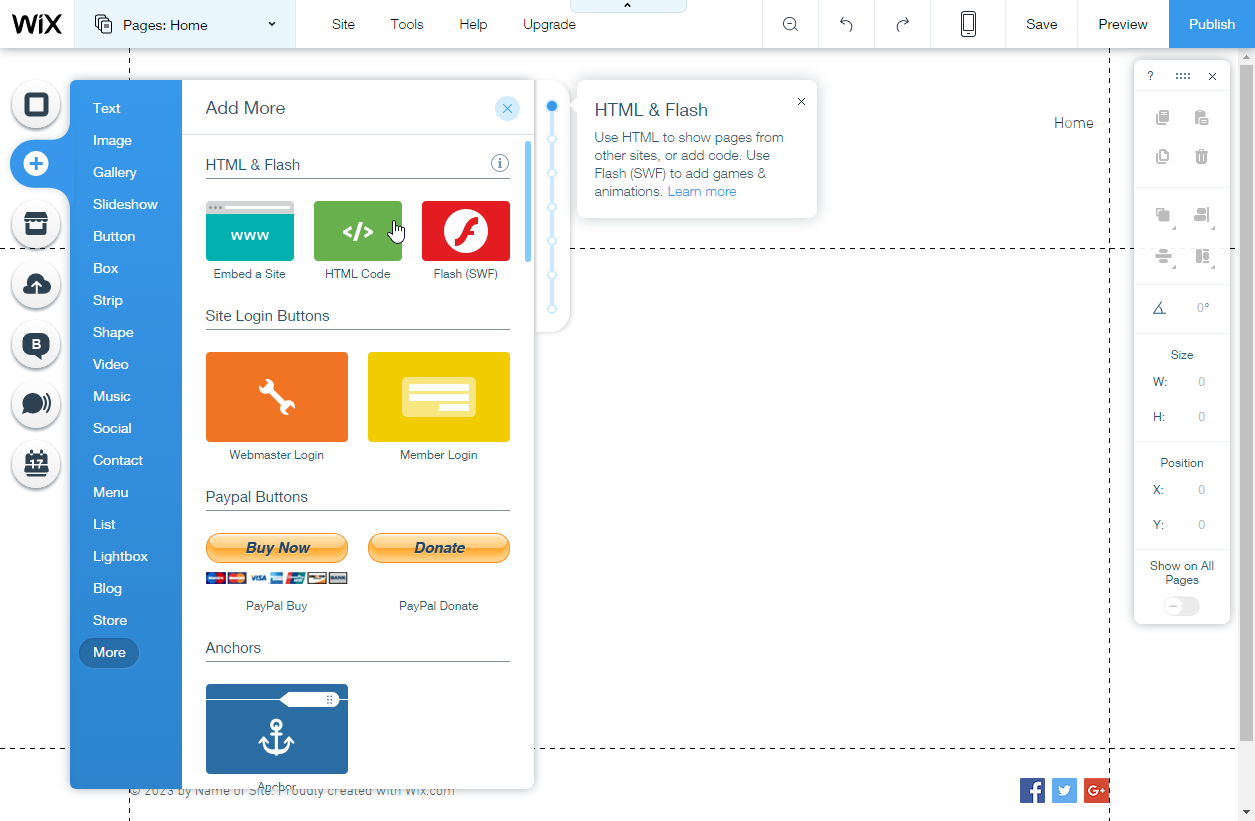
We're going to add such box and size it to fit our layout.
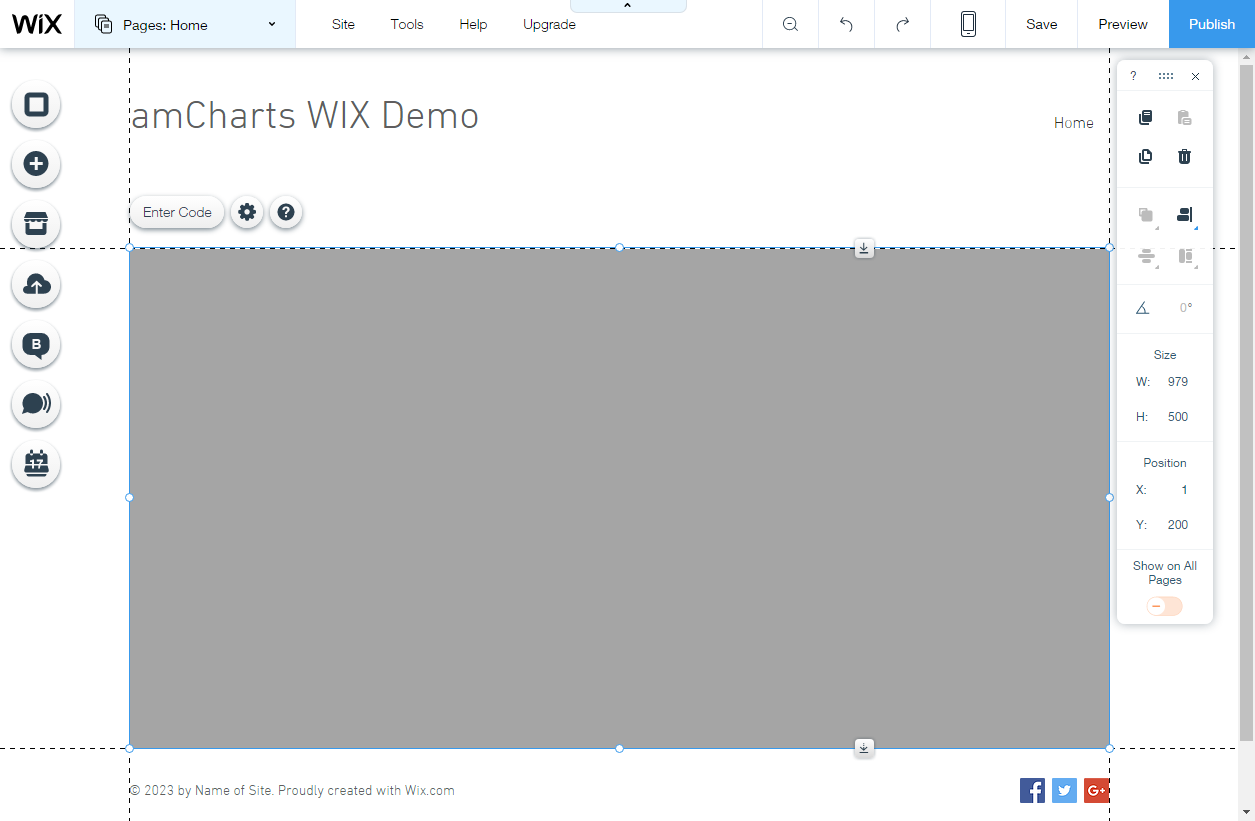
Now, the only think left for us to do is to add our code, which we'll do by clicking, yes you guessed it, "Enter Code" button.

I copy and paste our chart code, and... voila! A living and breathing live chart, right there in the WIX editor.

Now, if you save and publish your website, you will have your chart up.
What about the maps?
Same thing really. Same three code elements. Same routine.
Let's try with this simple map:
See the Pen WIX demo map by amCharts (@amcharts) on CodePen.24419
Now, let's walk through the same steps:
- Add an HTML Code block to page;
- Click Edit Code;
- Enter map's code;
- Save and publish.
Now you have a web page with both a chart and a map.

If I open the live website, I get my chart and map as well.
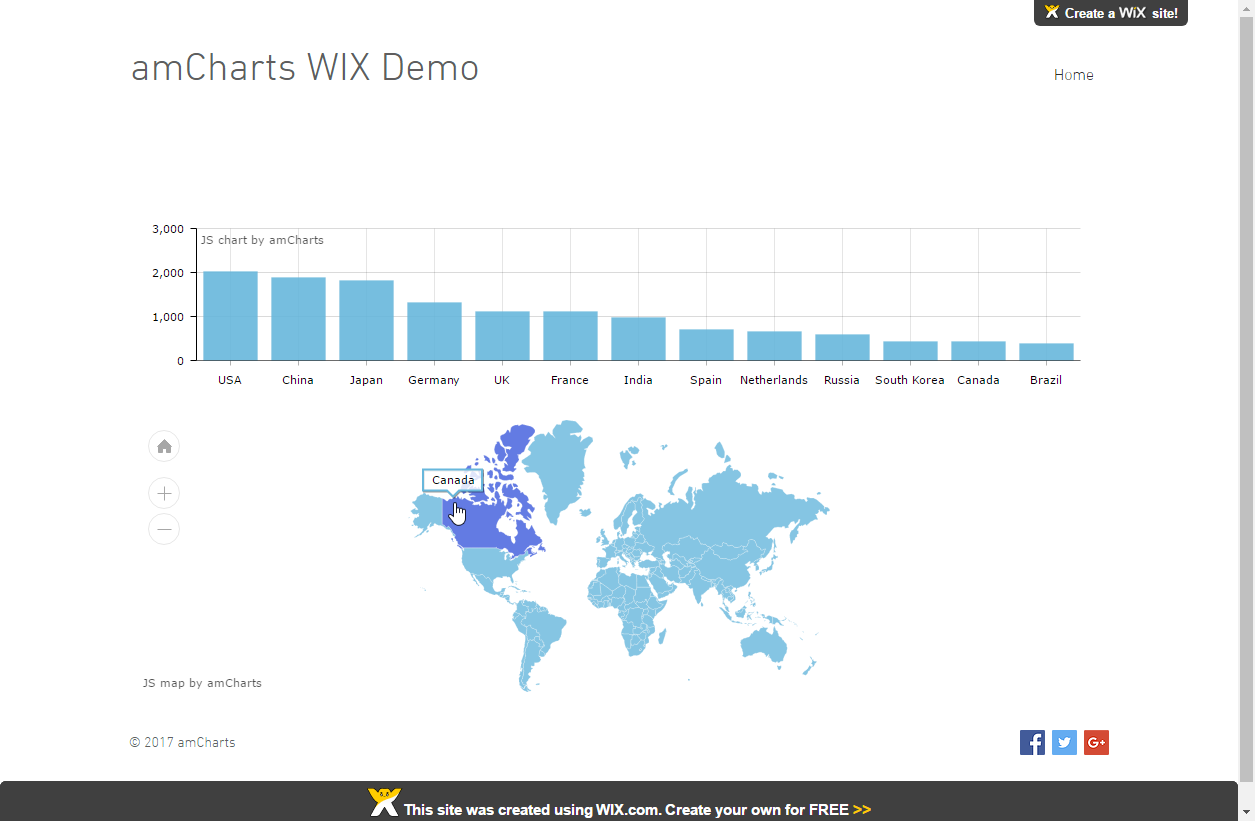
And, just in case you don't take my word for it, here's a link to the live WIX site I used to create this tutorial:
Where do we go from here?
Go create.
Use our editors to edit charts or maps.
Or, grab one of our demos as a starting point.
Visit our Knowledge Base section, which among many tutorials has countless examples with working code.
Finally, contact amCharts support, if stuck.