Despite what you may have heard, JavaScript Charts from amCharts CAN be used to create inline sparkline or microcharts. This article will walk you through the steps needed to minify your charts.
Let’s take some simple column chart as an example:
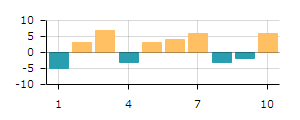
The code for the above chart is here.
Now let’s say I want to cram this chart as an inline inset within text. Naturally, first thing I have to do is to resize the chart to some lesser dimensions. Let’s set those to 110x30px and see what happens.
![]()
Oops. Not very useful, huh?
Let’s clean this mess up:
Step #1: Let’s get rid of the margins:
chart.autoMargins = false;
chart.marginLeft = 0;
chart.marginRight = 0;
chart.marginTop = 0;
chart.marginBottom = 0;
![]()
Much much better. Still messy, though.
Step #2: Gridlines and axes, be gone!
var valueAxis = new AmCharts.ValueAxis();
valueAxis.gridAlpha = 0;
valueAxis.axisAlpha = 0;
chart.addValueAxis(valueAxis);

var categoryAxis = chart.categoryAxis;
categoryAxis.gridAlpha = 0;
categoryAxis.axisAlpha = 0;
![]()
Hello, handsome!
Now let’s shove this beauty into text.
Lorem ipsum dolor sit <div id="chartdiv" style="width: 110px; height: 30px;"></div> amet, consectetur adipiscing elit.

Mooooooom, the chart is breaking up my lines!
Step #3: CSS chart container for inline use
These two CSS styles to the rescue:
display: inline-block;
vertical-align: middle;
Here’s how our updated code looks like:
Lorem ipsum dolor sit <div id="chartdiv" style="width: 110px; height: 30px; display: inline-block; vertical-align: middle;"></div> amet, consectetur adipiscing elit.
And here’s our show-ready inline chart:
![]()
Here’s the full source code for the chart above:
AmCharts.ready(function() {

	// column chart with different negative colors
	var chart = new AmCharts.AmSerialChart();
	chart.dataProvider = [{
		day: 1,
		value: -5
	}, {
		day: 2,
		value: 3
	}, {
		day: 3,
		value: 7
	}, {
		day: 4,
		value: -3
	}, {
		day: 5,
		value: 3
	}, {
		day: 6,
		value: 4
	}, {
		day: 7,
		value: 6
	}, {
		day: 8,
		value: -3
	}, {
		day: 9,
		value: -2
	}, {
		day: 10,
		value: 6
	}];
	chart.categoryField = "day";
	chart.autoMargins = false;
	chart.marginLeft = 0;
	chart.marginRight = 0;
	chart.marginTop = 0;
	chart.marginBottom = 0;

	var graph = new AmCharts.AmGraph();
	graph.valueField = "value";
	graph.type = "column";
	graph.fillAlphas = 1;
	graph.showBalloon = false;
	graph.lineColor = "#ffbf63";
	graph.negativeFillColors = "#289eaf";
	graph.negativeLineColor = "#289eaf";
	chart.addGraph(graph);

	var valueAxis = new AmCharts.ValueAxis();
	valueAxis.gridAlpha = 0;
	valueAxis.axisAlpha = 0;
	chart.addValueAxis(valueAxis);

	var categoryAxis = chart.categoryAxis;
	categoryAxis.gridAlpha = 0;
	categoryAxis.axisAlpha = 0;

	chart.write("columnfull");
});
Or exactly the same using JSON object:
AmCharts.makeChart("chartdiv", {
    "type": "serial",
    "dataProvider": [{
        "day": 1,
        "value": -5
    }, {
        "day": 2,
        "value": 3
    }, {
        "day": 3,
        "value": 7
    }, {
        "day": 4,
        "value": -3
    }, {
        "day": 5,
        "value": 3
    }, {
        "day": 6,
        "value": 4
    }, {
        "day": 7,
        "value": 6
    }, {
        "day": 8,
        "value": -3
    }, {
        "day": 9,
        "value": -2
    }, {
        "day": 10,
        "value": 6
    }],
    "valueAxes": [{
        "axisAlpha": 0,
        "gridAlpha": 0
    }],
    "graphs": [{
        "fillAlphas": 1,
        "lineColor": "#ffbf63",
        "negativeFillColors": "#289eaf",
        "negativeLineColor": "#289eaf",
        "showBalloon": false,
        "type": "column",
        "valueField": "value"
    }],
    "marginTop": 0,
    "marginRight": 0,
    "marginLeft": 0,
    "marginBottom": 0,
    "autoMargins": false,
    "categoryField": "day",
    "categoryAxis": {
        "axisAlpha": 0,
        "gridAlpha": 0
    }
});
Make sure you visit this page for more examples on how JavaScript Charts could be used as sparkline and microcharts.
P.S. Oh one more thing: sparklines are not usable with the free version of JavaScript Charts due to the branding link taking up much of the chart space. If you want to use our charts in this capacity, please consider acquiring a commercial license. You’ll get world-class charting library without any branding, receive priority support, and get karma points for helping the development ;)