As a Live Editor user, you probably spend a lot of time inserting the data manually if you are not familiar with our import feature.
In this tutorial we will guide you trough the process how to import your data into our Live Editor and link it's content with your graphs.
Opening the Live-Editor & Pick a template
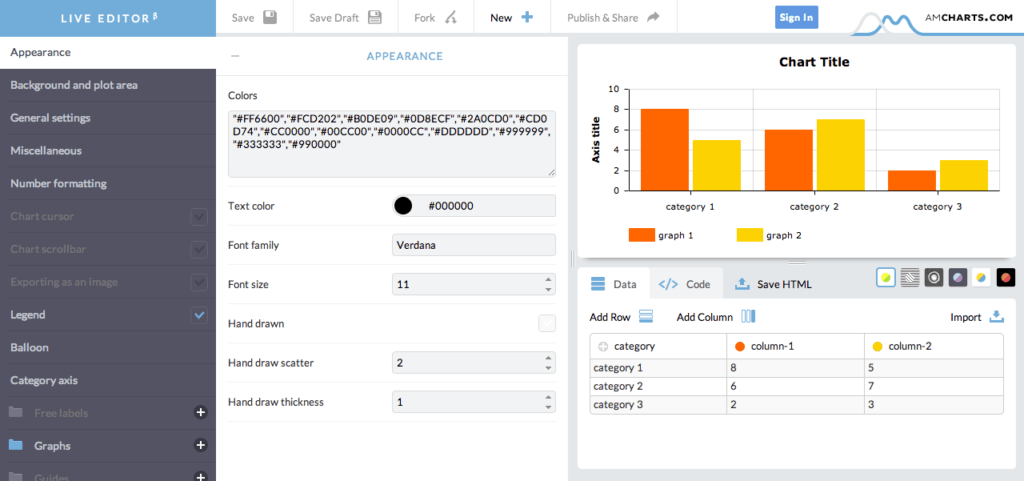
First you need to open the Live Editor and choose any template you want to start with, in this tutorial we've picked the "clustered" chart.
Once the template has been loaded and the editor has been successfully configured it should look like following image.
Upload your data & Tweak the settings
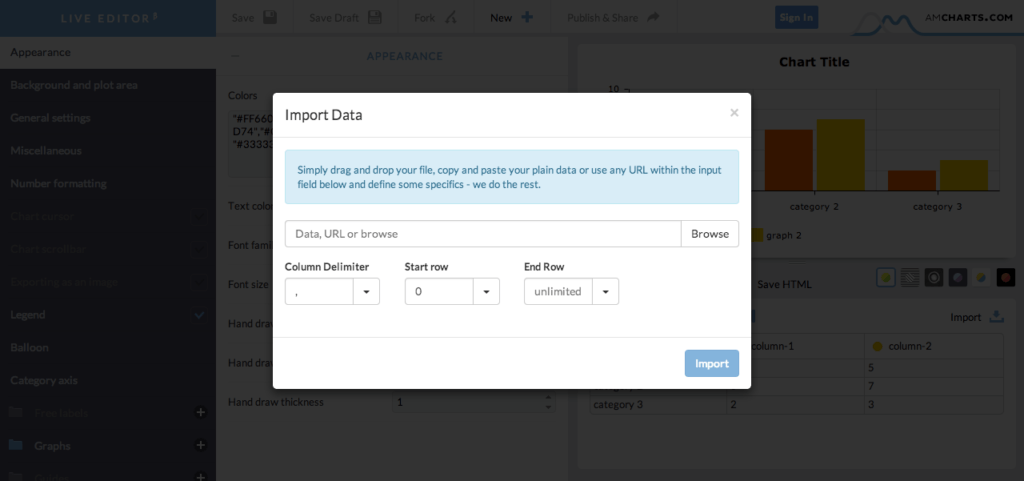
Now you can click on the "Import"-button on your right hand and a popup will show up with a little description.
You can also drag your file into the browser and the modal will show up automatically to save few seconds or choose one of the following alternates:
- Insert your RAW data inside the input field
- Paste your URL into the input field
- Click on browse and choose a file
Once you have applied your resource you can start to tweak following options settings:
- Column delimiter: Character to split each rows to gain the columns ( only for RAW data )
- Start row: Indicator to start the capturing, non-numeric value will start on first appearance.
- Stop row: Indicator to end the capturing, non-numeric value will start on first appearance after start.
If everything seems to be fine, click on "Import" to upload your resource.
Double check & Confirm your data
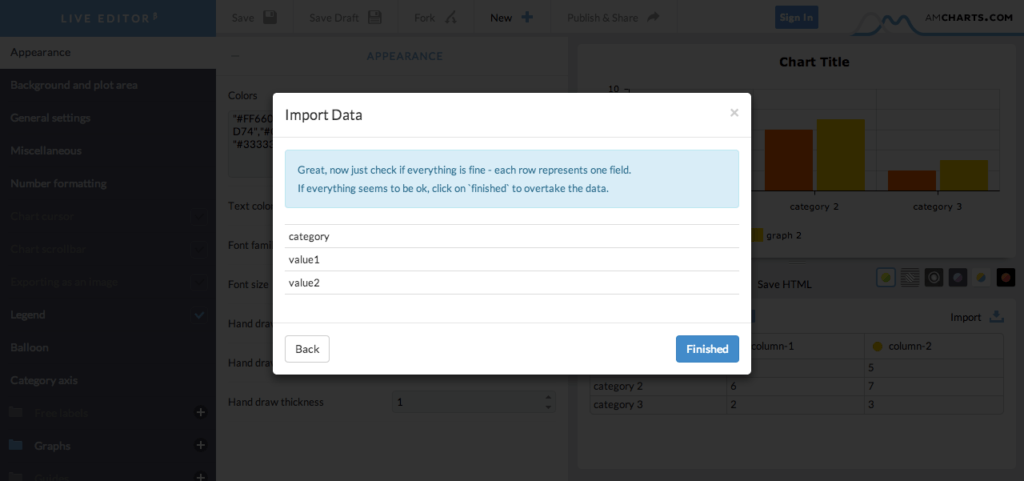
Before your uploaded data gets applied to the editor it asks for a confirmation just to double check if the processor worked correctly otherwise click on back and tweak the settings to get the right result.
There are two confirmation-views:
- Column confirmation ( in case of plain data or array-ish data )
- Sheet confirmation ( in case of objective data or multiple worksheets from a spreadsheet )
If everything is fine and the importer has detected the right columns or sheets, click on "Finished" to apply the selected sheet or data to your chart.
Configure your chart & Assign your data
Now you have successfully imported your resource into the editor and you are free to tweak your chart to your needs as usual.
You only need to assign your category for the x-axis and let your graphs know which fields they are about to use, therefore click on "General Settings" to define your "categoryField" from the dropdown.
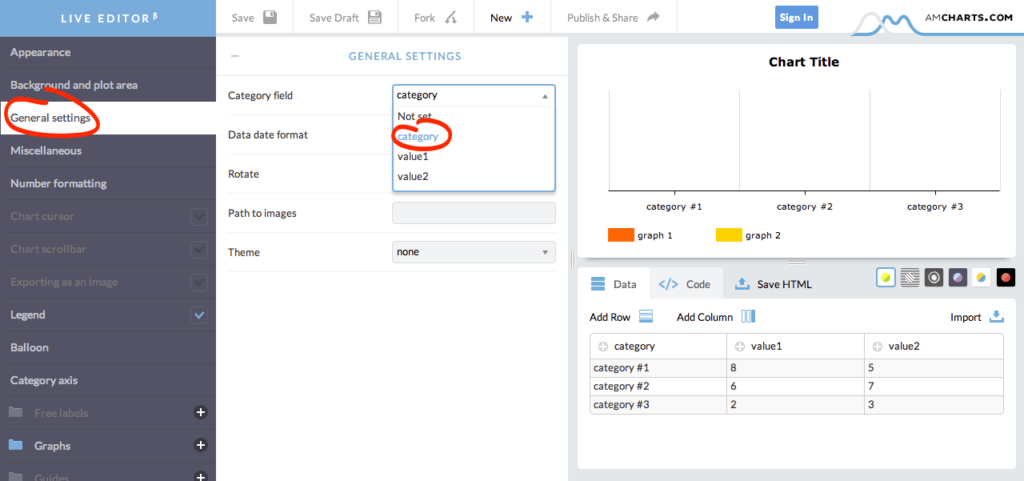
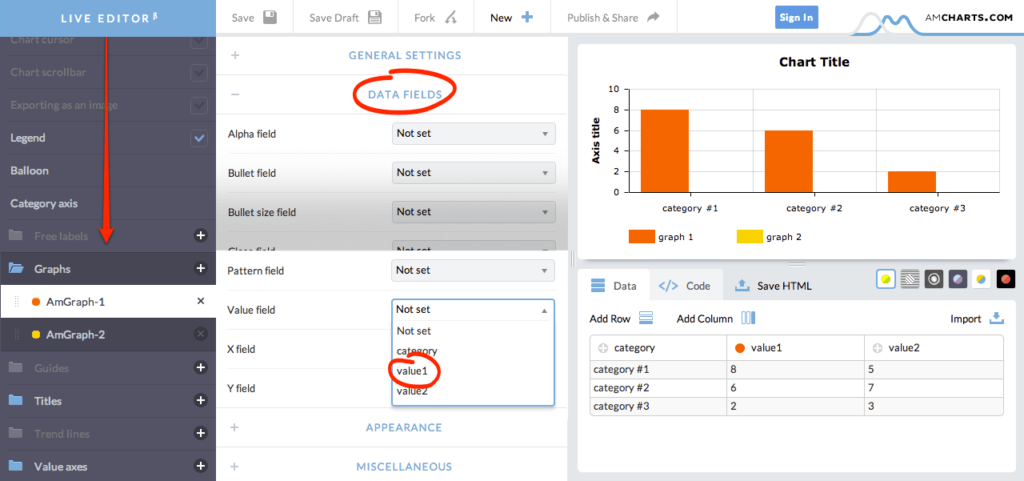
After that scroll a little bit down, if necessary, and click on "Graphs" in the left-hand menu. Choose your graph or create a new one with the little "Plus-sign" and open the "Data-Fields" tab in the middle menu to assign the "valueField" from your data.
Repeat this step for all missing graphs you need to apply.
Donekovski
Voilá here we go, you have successfully imported your data and assigned the graphs to it. We hope this will improve your workflow and save you some time.