IMPORTANT NOTICE! The information provided in this article is here for historical reference. We strongly suggest you consider using our official Data Loader plugin, which takes care of all the data loading automatically. However, bits and pieces of this article might still be useful for some. Please refer to this tutorial for further information.
In this tutorial we’ll produce a simple example of how to load and parse csv data from a file.
First, download amCharts package and unzip it. Copy amcharts folder from a package to your working dir. Then go to samples folder and copy lineWithDateBasedData.html to the same working dir. If you open this file with a browser, you won’t see anything – paths to amCharts files should be fixed first. Open lineWithDateBasedData.html with text editor and fix paths (delete ../) to the amcharts.js and serial.js files:
<script src="amcharts/amcharts.js" type="text/javascript"></script>
<script src="amcharts/serial.js" type="text/javascript"></script>
There is one more path which should be fixed:
chart.pathToImages = "amcharts/images/";
Now, if you open this file, you should see this chart:
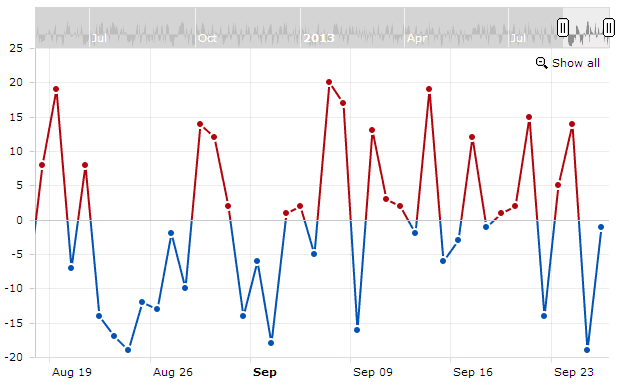
Data of this chart is generated html file, so it’s not good for us – we want to load external data.
Lets create a simple text file, called data.txt and add some data to it – first column contains dates and the second one has some numbers. Note, our data is irregular – it has gaps at weekends:
2011-02-23,133034
2011-02-24,122290
2011-02-25,383603
2011-02-28,125285
2011-03-01,118042
2011-03-02,102500
2011-03-03,434047
2011-03-04,422374
2011-03-07,396473
2011-03-08,453142
First column has date and the second column – numbers. Save this file to the same folder as lineWithDateBasedData.html file and then go back to the editor with lineWithDateBasedData.html file opened. Delete generateChartData method and also the line where it is called.
Loading data
Add a method which loads external data to the script:
function loadCSV(file) {
    var request;
    if (window.XMLHttpRequest) {
        // IE7+, Firefox, Chrome, Opera, Safari
        request = new XMLHttpRequest();
    } else {
        // code for IE6, IE5
        request = new ActiveXObject('Microsoft.XMLHTTP');
    }
    // load
    request.open('GET', file, false);
    request.send();
    parseCSV(request.responseText);
}
And another method which will parse data:
function parseCSV(data){
    alert(data);
}
Now call loadCSV function in the end of AmCharts.ready method (after the chart is created):
loadCSV("data.txt");
To check if data is loaded properly we added alert(data) line in the parseCSV method. Try to open lineWithDateBasedData.html with your browser now. As you guess, a popup should open with all the data from our data file. But… most likely it won’t. Loading external data requires all the files to be on a web server, this script won’t run if you simply open the file from your hard drive. This means you have to upload all the files to your web site, or, if you have a web server installed on your computer, move all your files to your localhost folder and view the page via your localhost address. Now, you should get the popup. Here you can find html with all the steps made so far (and see the popup with data). View source of this page in case you can’t get the same result.
Note, your data file can be dynamic. This means you can load data from php, asp or any other script which could access data base and generate data you need. This tutorial explains how you can use PHP to get data from mySQL data base and generate JSON string which can by used by the chart.
Parsing data
Delete alert(data); line so it won’t bug you anymore. Next we’ll split our data into rows. As new line can be “marked” as n, also as r and as rn, first we’ll replace r and rn into n, and only then split data string. The following lines should go to the parseCSV method:
//replace UNIX new lines
data = data.replace (/rn/g, "n");
//replace MAC new lines
data = data.replace (/r/g, "n");
//split into rows
var rows = data.split("n");
Now we have array of rows and we’ll loop through this array to extract data. Before this, I declared variable dataProvider in the top of the script. Below is full script which loads and parses data:
// loop through all rows
for (var i = 0; i < rows.length; i++) {
    // this line helps to skip empty rows
    if (rows[i]) {
        // our columns are separated by comma
        var column = rows[i].split(",");

        // column is array now
        // first item is date
        var date = column[0];
        // second item is value of the second column
        var value = column[1];

        // create object which contains all these items:
        var dataObject = {
            date: date,
            visits: value
        };
        // add object to chartData array
        chartData.push(dataObject);
    }
}
chart.validateData();
I called the value field in the data "visits", because we already have a graph created with valueField set as "visits". It’s up to you how you want to call it. However don’t forget to change graph.valueField if you use a different name. Same with "date" field – you can give any name to it, but then you should also change chart.categoryField value.
If you analyze the code of the chart, you’ll notice this line: categoryAxis.parseDates = true; - this means our chart parses dates. When chart parses dates, you have two options 1) pass category values as Date objects; 2) set data date format for the chart. As our original example used date objects, and when we loaded data, we have simple date strings, we have to do the 2nd option. So you should add this line:
chart.dataDateFormat = "YYYY-MM-DD";
Side note – some users might notice, that in this particular case the chart will work even without this line. This happens because this particular date format is parsed automatically by modern browsers, however if we have used a different date format, the chart won’t work. It won’t work on IE8 and older too.
As our chart is already created, and even chartData variable set as data provider of a chart, all we need to do after data is parsed, is to call:
chart.validateData();
Now, open your html in browser and you should see this:
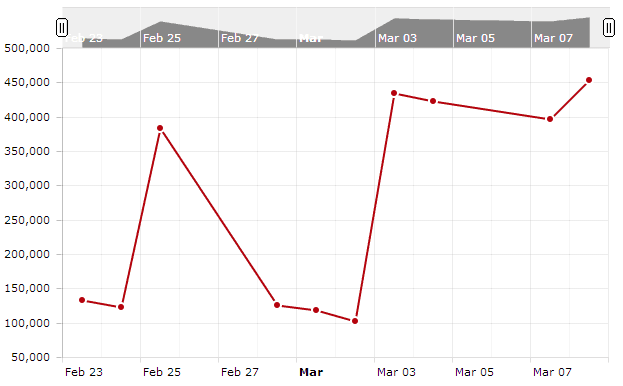
And here is a working example of all what we've done here.