![]() Psssst! Want to put together the config for your first map faster? Try our Pixel Map tool.
Psssst! Want to put together the config for your first map faster? Try our Pixel Map tool.
JavaScript amMap is a piece of software for creating interactive maps for your web sites and applications. It’s quite different from mapping products like Google Maps, and so is its purpose. We do not provide deep-level maps like Google Maps does. We offer world map, continents map and a lot of country maps with district borders. We do not offer city maps or satellite images, our maps consist of pure country/district areas. Here are some examples of our mapping tool in use:
- United States Heat Map
- Interactive Flight Route Map
- Drill-down map
- Grouped countries map
- World capitals map
- Zooming to countries map
Our tool uses SVG to render maps. We do not offer VML which would be needed to support Internet Explorer browses version 8 and older. VML is simply too slow to handle this amount of vector data. Sorry legacy browser lovers ;)
Creating your first map
Download amMap package, unzip it to some folder and copy "ammap" folder to your working directory. Now open your HTML file (I will assume that it is in the same level where you copied ammap folder). First, you should include ammap.js and ammap.css into header of your HTML:
<script src="ammap/ammap.js" type="text/javascript"></script>
<link rel="stylesheet" href="ammap/ammap.css" type="text/css" media="all" />
In case you are using our amcharts js file in the same page, you can insert ammap_amcharts_extension.js instead of ammap.js – this will save you ~50 kilobytes. Remember, you have to insert ammap_amcharts_extension.js after amcharts.js file!
Next, you have to insert map file too. Actually there are two ways of using maps – you can load SVG files at runtime or insert maps as .js files. We recommend inserting maps as .js files as it is much more reliable - some servers do not like SVG format. Also you will not be able to test maps without web server if you load them as SVG.
To insert map file as .js file simply add this line to your HTML (after the line where you inserted ammap.js file!):
<script src="ammap/maps/js/worldLow.js" type="text/javascript"></script>
You can use any other map – just go to the ammap/maps/js folder and check the available maps (we are adding new maps constantly).
Side note: we include two versions of most of the maps – high detail and low detail. Normally you should always use maps with "Low" suffix as they are faster and less resource-intensive. If your particular purpose calls for for greater detail and you’re willing to potentially sacrifice some performance for it, go with the "High" version.
In case you wish to load maps as SVG files – read on, we’ll cover this a bit later.
Next, you should create a div which will hold your map. Add this to your HTML body:
<div id="mapdiv" style="width: 600px; height: 400px;"></div>
Now we’ll do some JavaScripting. Below is a script with comments which should produce a simple World map:
AmCharts.makeChart( "mapdiv", {
  /**
   * this tells amCharts it's a map
   */
  "type": "map",

  /**
   * create data provider object
   * map property is usually the same as the name of the map file.
   * getAreasFromMap indicates that amMap should read all the areas available
   * in the map data and treat them as they are included in your data provider.
   * in case you don't set it to true, all the areas except listed in data
   * provider will be treated as unlisted.
   */
  "dataProvider": {
    "map": "worldLow",
    "getAreasFromMap": true
  },

  /**
   * create areas settings
   * autoZoom set to true means that the map will zoom-in when clicked on the area
   * selectedColor indicates color of the clicked area.
   */
  "areasSettings": {
    "autoZoom": true,
    "selectedColor": "#CC0000"
  },

  /**
   * let's say we want a small map to be displayed, so let's create it
   */
  "smallMap": {}
} );
Now, if you open your HTML file in a browser, you should see this:
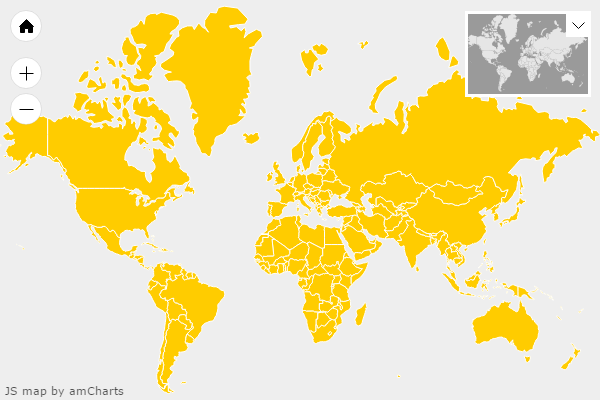
Try to click on any country – the map will zoom-in on it. You can also drag, pan the map or click on a small map to move the big one to the desired position. In case you don’t see the map, check error console – most likely it will show some errors. It’s a first to-do if something is not working.
You can work with amMap using JavaScript API (like in this tutorial), or you can add all config to JSON object. Here is a working sample of the same map made with JSON.
Loading SVG maps
In case you wish to load SVG maps instead of including them as .js file, all you need to do is to change "map" property of your data provider to mapURL and specify path to the SVG map, for example:
mapURL: "ammap/maps/svg/worldLow.svg",
However, as we mentioned, it’s not as reliable as including maps as .js files.
Manipulating areas (countries)
Let’s say we want to change color of some of the countries. This should be done by adding these countries to data provider and specifying color of your choice. Map data provider is an instance of MapData object, check our docs to find more of what it is capable of.
Each country/area has an id. For world map we use ISO country codes like US, UK, DE for id’s. For countries administrative areas we use id’s like AU_WA where AU is ISO code of the country (Australia in this case) and WA is id of the administrative area. All the available areas are listed in each map’s .js and .svg files, in JavaScript array which you can copy/paste directly to data provider. I left only some of the countries, as I don’t need them all:
"dataProvider": {
  "map": "worldLow",
  "areas": [
    { "id": "AU" },
    { "id": "US" },
    { "id": "FR" }
  ]
}
Note, I deleted getAreasFromMap:true from data provider, as now I want all the areas except those three to be inactive. The result is this:
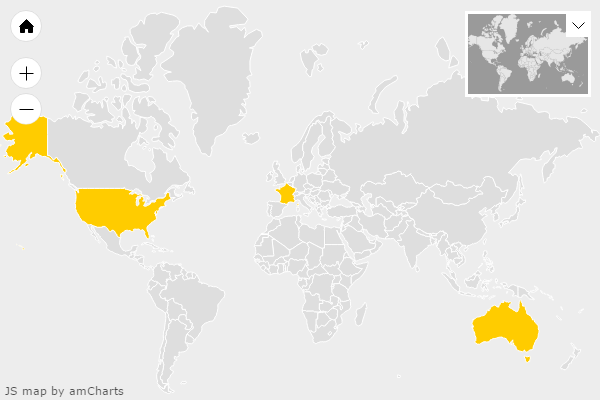
All the areas except listed are now grey. This color is set via AreasSettings unlistedAreasColor property. You can also control opacity, outline color and opacity of unlisted areas.
The three areas we included are colored with color set via color property of AreasSettings. Check all the available properties to get impression of what else you can change. As you have correctly guessed, the settings you set for AreasSettings are applied for all listed areas, but only if you don’t set some property of the area explicitly.
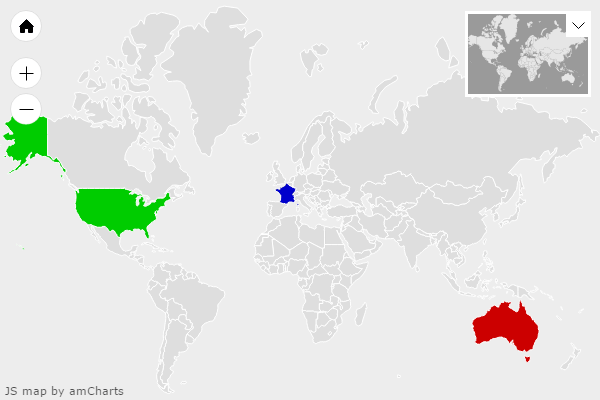
Each country/area object listed in your data provider is an instance of MapArea. Check docs to see list of available properties. Let’s say we want each of the three countries to be filled with a different color. The property responsible for this is color (surprise!). So we modify data provider by adding color with some HEX color code to each country:
"dataProvider": {
  "map": "worldLow",
  "areas":[
    { "id": "AU", "color": "#CC0000" },
    { "id": "US", "color": "#00CC00" },
    { "id": "FR", "color": "#0000CC" }
  ]
}
And the result is now:
You can modify color, opacity, title (titles are hardcoded in a map, but you can simply change them using “title” property), add description which will popup if user clicks on a country and do a lot more.
Adding an image to the map
Let’s say I want to add some icon on the map in the place where New York City is. This will also be done via data provider, images property. Images are instances of MapImage object. Images can be placed in two ways – by setting it’s position using left/top/right/bottom properties or by setting latitude and longitude. If you set latitude and longitude, the image will be bound to the map position – it will move together with it. Otherwise the image will stay in the same place. As I want to mark New York City, I need to set latitude and longitude. So I went to Wikipedia and found that latitude is 40.3951 and longitude is -73.5619.
MapImage has “type” property which can be set to one of the three values: circle, rectangle and bubble. I choose “bubble” this time and set its color to velvet:
"dataProvider": {
  "map": "worldLow",
  "images": [ {
    "latitude": 40.3951,
    "longitude": -73.5619,
    "type": "circle",
    "color": "#6c00ff"
  } ]
}
Note, I deleted areas so that they wouldn’t steal your attention. And here is the result:
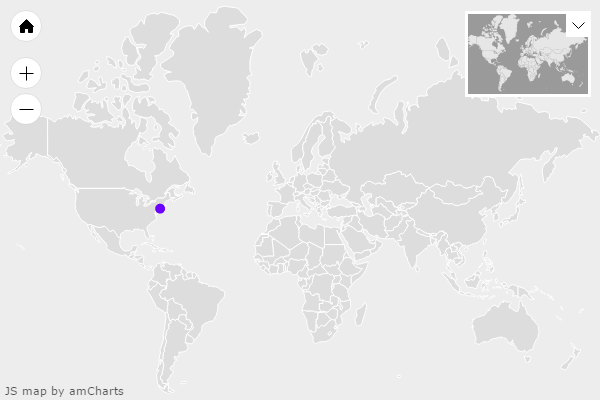
As you can see, there is a red circle in the place where New York City is! Most of the maps we provide are calibrated, so real world latitudes and longitudes can be used. Only some of the maps for some technical reasons can not be calibrated (for example map of US where Alaska an Hawaii are shifted so that they would be close to mainland).
You can still find longitudes/latitudes (and also a lot more information required to build maps) both for calibrated and non-calibrated maps using developer mode. Check developerMode.html example in samples folder to see it in action.
Now I want to change the red circle to some more interesting picture. You can load gif, png, jpg or svg files by setting imageURL for your image with path to the image. However loaded images have limitations – you can not change colors, set outline and some more. The recommended way of adding single-color images to the map would be creating variable of SVG path and setting it via svgPath property of MapImage.
/**
 * Let's put an SVG icon into a variable so that we can reuse it for multiple markers
 */
var icon = "M21.25,8.375V28h6.5V8.375H21.25zM12.25,28h6.5V4.125h-6.5V28zM3.25,28h6.5V12.625h-6.5V28z";

AmCharts.makeChart( "mapdiv", {
  "type": "map",
  "dataProvider": {
    "map": "worldLow",
    "images": [ {
      "latitude": 40.3951,
      "longitude": -73.5619,
      "svgPath": icon,
      "color": "#CC0000",
      "scale": 0.5,
      "label": "New York",
      "labelShiftY": 2
    } ]
  }
} );
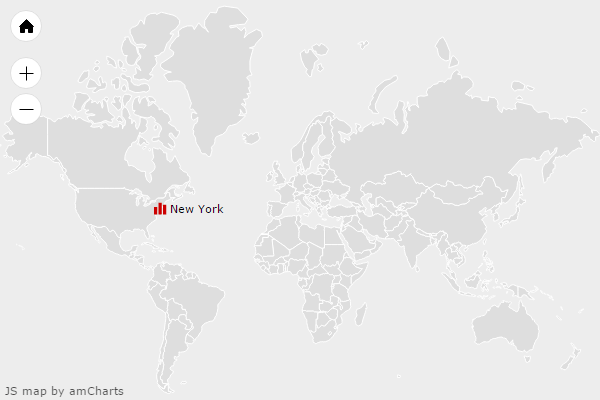
Note, I deleted type (we don’t need it anymore) and set scale to 0.5 so that the icon wouldn't be too big, I also added label property with value "New York" and adjusted label’s vertical position by 2 pixels so that it would fit better. And the result (after I manually zoomed in) is:
Adding some interactivity
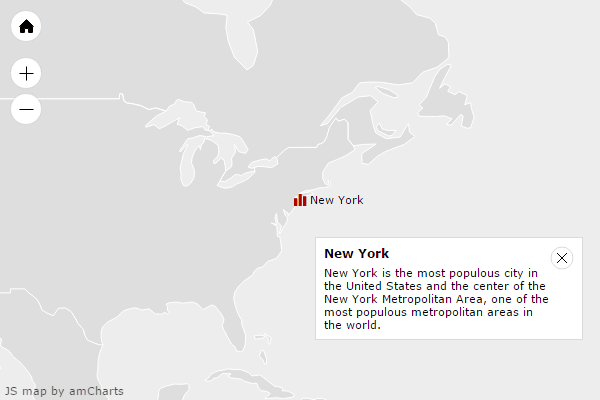
Now I want to make the New York icon clickable and I want the map to zoom-in and display some more information when user clicks on it. MapImage has all the properties you need to do that: value set as description will be displayed in a popup window, zoomLevel will tell how much do you want to zoom-in:
/**
 * Let's put an SVG icon into a variable so that we can reuse it for multiple markers
 */
var icon= "M21.25,8.375V28h6.5V8.375H21.25zM12.25,28h6.5V4.125h-6.5V28zM3.25,28h6.5V12.625h-6.5V28z";

AmCharts.makeChart( "mapdiv", {
  "type": "map",
  "dataProvider": {
    "map": "worldLow",
    images: [ {
      "latitude": 40.3951,
      "longitude": -73.5619,
      "svgPath": icon,
      "color": "#CC0000",
      "scale": 0.5,
      "label": "New York",
      "labelShiftY": 2,
      "zoomLevel": 5,
      "title": "New York",
      "description": "New York is the most populous city in the United States and the center of the New York Metropolitan Area, one of the most populous metropolitan areas in the world."
    } ]
  }
} );
Now, after you click on "New York" icon, the map will zoom in and display description:
That’s it for this tutorial. You can do a lot more – drill-down maps, heat maps. Not only you can display images but also draw lines on top of the map. You can use amMap together with amCharts and create stunning data visualizations. Good luck!