The purpose of this article is to show you how you can hook up your client-side charts to the database servers on your back end using server-side scripting languages.
On the server side we’ll be using MySQL and PHP. However the principles outlined in this article will be applicable to any combination of server-side technologies, like ASP.NET+MSSQL, etc.
We’re gonna follow this natural progression:
- Create and populate sample MySQL table, that we will be using for tests.
- Create PHP scripts, that load data off the DB server and generate data suitable, for charts.
- Implement a plain vanilla JavaScript data loader to load the data from the server.
- Hook it all together to a working serial chart prototype.
#1: The database
For testing purposes, I’m going to create a very basic 3 column database table "my_chart_data": 1 column for category and 2 value columns. I’m also going to populate it with some random data:
CREATE TABLE IF NOT EXISTS `my_chart_data` (
  `category` date NOT NULL,
  `value1` int(11) NOT NULL,
  `value2` int(11) NOT NULL
);
Then we’ll populate with some data:
INSERT INTO `my_chart_data` (`category`, `value1`, `value2`) VALUES
('2013-08-24', 417, 127),
('2013-08-25', 417, 356),
('2013-08-26', 531, 585),
('2013-08-27', 333, 910),
('2013-08-28', 552, 30),
('2013-08-29', 492, 371),
('2013-08-30', 379, 781),
('2013-08-31', 767, 494),
('2013-09-01', 169, 364),
('2013-09-02', 314, 476),
('2013-09-03', 437, 759);
#2: Generating the data
In this step we’re going to create a PHP script that connects to MySQL server, loads the data and outputs the data in JSON format, which is a de facto standard for JavaScript-based applications.
<?php
// Connect to MySQL
$link = new mysqli( 'localhost', 'root', '', 'test' );
if ( $link->connect_errno ) {
  die( "Failed to connect to MySQL: (" . $link->connect_errno . ") " . $link->connect_error );
}

// Fetch the data
$query = "
  SELECT *
  FROM my_chart_data
  ORDER BY category ASC";
$result = $link->query( $query );

// All good?
if ( !$result ) {
  // Nope
  $message  = 'Invalid query: ' . $link->error . "n";
  $message .= 'Whole query: ' . $query;
  die( $message );
}

// Print out rows
while ( $row = $result->fetch_assoc() ) {
  echo $row['category'] . ' | ' . $row['value1'] . ' | ' .$row['value2'] . "n";
}

// Close the connection
mysqli_close($link);
?>
This prints out the data from our table nicely:
2013-08-24 | 417 | 127
2013-08-25 | 417 | 356
2013-08-26 | 531 | 585
2013-08-27 | 333 | 910
2013-08-28 | 552 | 30
2013-08-29 | 492 | 371
2013-08-30 | 379 | 781
2013-08-31 | 767 | 494
2013-09-01 | 169 | 364
2013-09-02 | 314 | 476
2013-09-03 | 437 | 759
That’s nice, but that’s not JSON, we’re aiming for. Let’s modify our script to produce a valid JSON output:
// Set proper HTTP response headers
header( 'Content-Type: application/json' );

// Print out rows
$data = array();
while ( $row = $result->fetch_assoc() ) {
  $data[] = $row;
}
echo json_encode( $data );
Now it produces a nicely formatted, valid JSON data:
[{
  "category": "2013-08-24",
  "value1": 417,
  "value2": 127
}, {
  "category": "2013-08-25",
  "value1": 417,
  "value2": 356
}, {
  "category": "2013-08-26",
  "value1": 531,
  "value2": 585
}, {
  "category": "2013-08-27",
  "value1": 333,
  "value2": 910
}, {
  "category": "2013-08-28",
  "value1": 552,
  "value2": 30
}, {
  "category": "2013-08-29",
  "value1": 492,
  "value2": 371
}, {
  "category": "2013-08-30",
  "value1": 379,
  "value2": 781
}, {
  "category": "2013-08-31",
  "value1": 767,
  "value2": 494
}, {
  "category": "2013-09-01",
  "value1": 169,
  "value2": 364
}, {
  "category": "2013-09-02",
  "value1": 314,
  "value2": 476
}, {
  "category": "2013-09-03",
  "value1": 437,
  "value2": 759
}]
Let’s go and verify the output if it’s a valid JSON. Yup, it is.

IMPORTANT NOTE: the order of data points is important. Date-based chart always expects data ordered in ascending order. Having out of order data points may result in weird visual glitches on the chart.
#3: Making the charts load the data
Bundled with every amCharts library (since version 3.13.3) there's a nice little plugin that we can use to do all the heavy lifting of loading external data for us.
To utilize it, we will just need to do two simple things.
a) Include the plugin file:
<script src="http://www.amcharts.com/lib/3/plugins/dataloader/dataloader.min.js" type="text/javascript"></script>
Important! The above include must come after all other amCharts includes such as amcharts.js.
b) Add a few options to our chart config, instructing the plugin where to look for our data, i.e.:
AmCharts.makeChart( "chartdiv", {
  "type": "serial",
  "dataLoader": {
    "url": "data.php",
    "format": "json"
  },
  // we'll skip the rest of the config for now
  // ..
} );
NOTE: Due to JavaScript security restrictions, the above will not work if you load the page locally (via file:///). You need to have it loaded via web server (http://)
#4: Build a fully functional chart using loaded data
Here’s the full code for the chart:
var chart = AmCharts.makeChart( "chartdiv", {
  "type": "serial",
  "dataLoader": {
    "url": "data.php"
  },
  "categoryField": "category",
  "dataDateFormat": "YYYY-MM-DD",
  "startDuration": 1,
  "rotate": true,
  "categoryAxis": {
    "parseDates": true
  },
  "graphs": [ {
    "valueField": "value1",
    "bullet": "round",
    "bulletBorderColor": "#FFFFFF",
    "bulletBorderThickness": 2,
    "lineThickness ": 2,
    "lineAlpha": 0.5
  }, {
    "valueField": "value2",
    "bullet": "round",
    "bulletBorderColor": "#FFFFFF",
    "bulletBorderThickness": 2,
    "lineThickness ": 2,
    "lineAlpha": 0.5
  } ]
} );
And here’s, Ladies and Gentlemen, the final output:
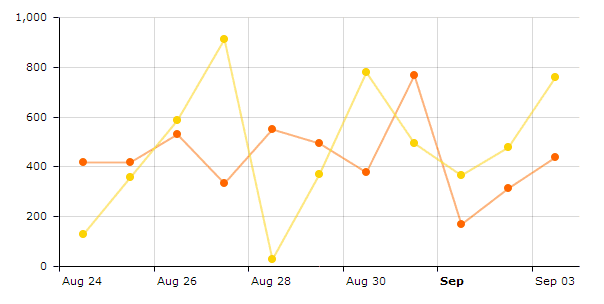
If you’re not big on copying and pasting the code, you can download the complete working example with all the files used in this tutorial here: tutorial_assets_external-data_v3.zip