JavaScript charts & maps · Online tools
Code it.
Or click it.
Both free, even commercially, with our logo.
Trusted by 20,000+ companies worldwide
Fresh from the lab.

"Can't AI just generate my charts?"
Sure. And the first result will look great.
Then you'll need an interactive legend. Then zoom and scroll. Then responsive layouts on mobile. Then accessible labels. Then data grouped into weeks and months automatically. Then smooth transitions between datasets.
Each requirement means another prompt. Each prompt introduces new bugs. You end up debugging AI output instead of shipping your product.
The amCharts answer: one prompt, done.
Tell AI to use amCharts and all of the above comes built in. No extra prompts, no fragile workarounds — a real charting engine does the heavy lifting.
Not a charting library. A data-viz platform.
Every part of an amCharts chart is a live object: a column, an axis label, a map region, a tooltip. Read it, restyle it, animate it, or draw your own shapes on top, in the same coordinates as your data. You get the freedom of building from scratch, without the edge cases: resizing, touch and zoom, accessibility, export, time zones, large data.
60+ chart types — bars, pies, Sankey, treemap, spiral timelines and many more.
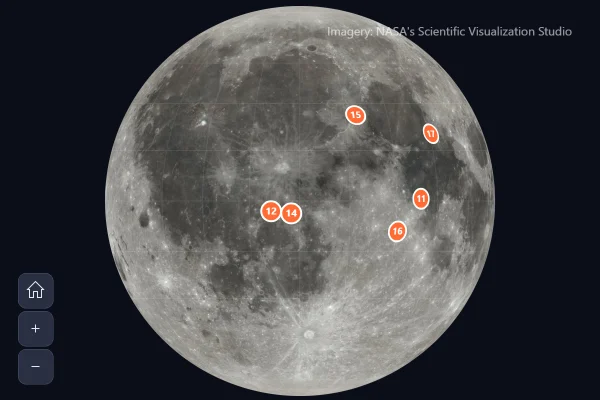
Explore ChartsInteractive geo maps with hundreds of bundled GeoJSON datasets, heat rules, and point clustering.
Explore MapsProfessional financial charting with 34 built-in indicators, 22 drawing tools, and multi-panel layouts.
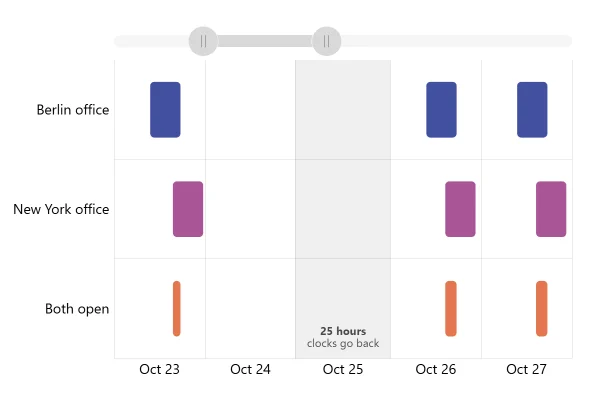
Explore Stock ChartDrag-and-drop project timelines with dependency links, resource allocation, and full event API.
Explore GanttNo code? Online Tools: Chart Maker for charts and maps, SVG Map Generator, Pixel Map Generator and SVG Maps. Free to start.
Composable layouts
Multiple charts in one container. Stack them, grid them, overlay them — a pie chart on top of a map, a gauge beside a line chart.
60+ chart types
Line, area, Sankey, treemap, radar, maps, stock, Gantt — plus the rarer ones: serpentine timelines, spiral charts, Voronoi treemaps, packed circles. All in one library.
Everything animates
Any element, any property — including the data itself. Zoom and scroll feel silky smooth because amCharts animates data values, not DOM elements. The difference is visceral.
Canvas-powered speed
Draws on HTML5 Canvas by default: faster rendering, smoother interactions, smaller memory footprint. The performance gap grows with every data point you add.
Crisp SVG, too
Prefer vectors? One setting draws the same chart as live SVG: sharp at any zoom and in print, and every shape is there to inspect in DevTools. Any chart also saves as an SVG file for Figma or Illustrator.
Accessibility built in
Screen reader support, keyboard navigation, focusable elements, ARIA attributes — first-class, not retrofitted. Pass enterprise accessibility audits out of the box.
Free. Even for commercial use.
Use amCharts at no cost — on any project, including commercial — with the amCharts logo on the charts. When you're ready to remove it, choose the plan that fits.
Full functionality, with the amCharts logo on the charts. No time or user limits.
- All chart types
- Commercial projects
- Unlimited users & pages
Charting as a subscription. Stay current with free upgrades, priority support (SaaS or OEM licenses), and predictable budgeting.
- No amCharts logo
- Free version upgrades
- Source code access
Buy once, use forever. No renewals, no expiration. Yours to keep — including all future updates to the version you purchase.
- No amCharts logo
- Lifetime license
- Source code access
SaaS and OEM licenses also available: see all licenses. Making charts without code? amCharts Pro, $9/month, adds room, publishing and PNG and SVG exports without the credit.
Battle-tested across 20 years of production.
amCharts has shipped in products you've used — trading platforms, hospital dashboards, satellite telemetry, live election maps. Every edge case, every performance bottleneck, every API quirk is ironed out.
Every element is fully dynamic
Access and change any element at runtime — appearance, position, data, visibility. Your charts respond to your application, not the other way around.
Support from people who wrote the code
When you hit a strange edge case the night before a product launch, our team has likely seen it before. Real humans, real answers.
If it can be visualized, amCharts can build it.
From common charts to rare ones — serpentine timelines, spiral charts, Voronoi treemaps, directed chord diagrams. One library handles them all.
DataViz Dojo
A playground of interactive data-viz projects — chart races, geography games, animated recreations of classic visualizations. Built mostly with AI to show what's possible when amCharts meets modern tooling.
AI handles the complexity. You keep the control.
amCharts has always been powerful. Now AI eliminates the learning curve. Describe what you want — AI writes correct amCharts code.
amCharts MCP
Use our hosted server or run it locally. Your AI assistant gets the docs, code examples and the full API reference on demand. Works with Claude Code, Cursor, Windsurf and VS Code.
Set up the MCP serverAI Skill Files
Drop the skill file into your project, and AI coding tools that read project files get a structured reference for every chart type. No setup.
Get the skill fileamCharts & AI
How AI and amCharts work together — setup guides, knowledge base stats, featured projects, and everything you need to get started.
Explore amCharts & AI