Embedding Interactive Maps Created with Map Editor
Intro
In this post, we’ll take a look into ways we can embed map setups created using Online Map Editor by amCharts.
For a crash course on what Map Editor is and what it can do, please read our previous post: “Introducing Online Map Editor“.
Standalone HTML File
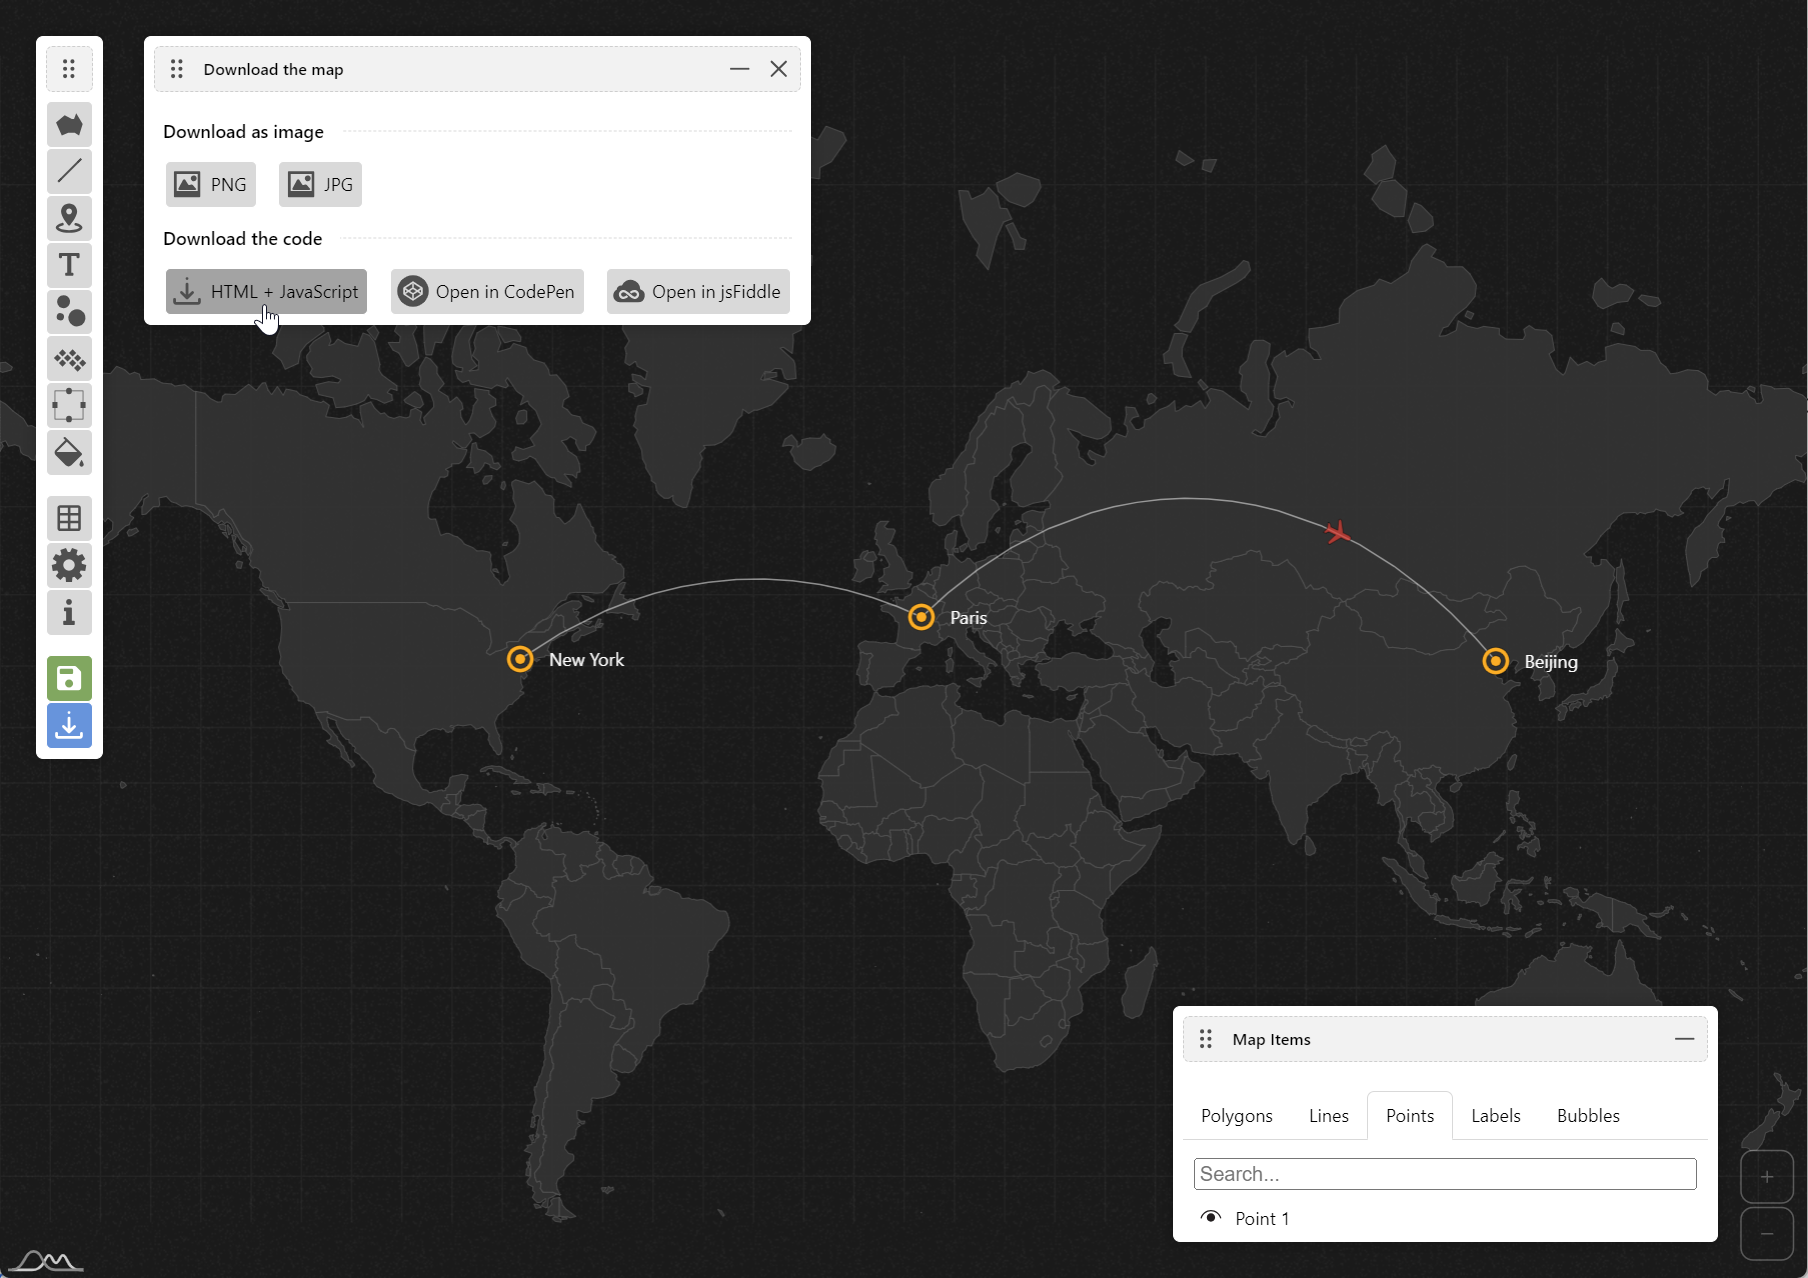
Map Editor can save your whole configured map as a completely self-sufficient HTML file.
To do so, open Download tool, and click the “HTML + JavaScript” button.
Save the file.
You can open it directly in a browser, email it, or display on your website in an <iframe>, e.g.:
<iframe src="/path/to/WorldMap.html" style="width: 100%; height: 500px;"></iframe>The HTML file will contain all the necessary markup, as well as JavaScript files needed to run the map, loaded from amCharts CDN.
Embedding Using Third Party Services
You can use “Open in CodePen” or “Open in jsFiddle” buttons to open your map in those respective services, with their HTML, CSS, and JavaScript sections pre-filled.
You can preview the output, and even edit the code there.
Both of those services allow saving pages (pens or fiddles) then embedding them directly into your websites using easily generated code, which might be an easier alternative to using standalone HTML file.
Here’s a sample map, saved in CodePen:
See the Pen My World map by amCharts by amCharts team (@amcharts) on CodePen.
Adding to WordPress Posts and Pages
If you are using amCharts WordPress plugin, you can use CodePen or jsFiddle to easily grab the code to paste into WordPress.
To port a map setup from a CodePen to a new WordPress chart:
- Copy
<script>file URLs from CodePen’s “HTML” tab into WP’ “Resourcers” box. - Copy the rest of “HTML” tab content into WP’s “HTML” box. You might want to add dimension styles to the the map
<div>element. - Copy contents of “JavaScript” tab into WP’s “JavaScript” box.
Getting the Code
You can also use CodePen/jsFiddle option to easily grab HTML and JavaScript that comprises map.
To view map, you will need 3 things:
1) Viewer script:
<script src="https://cdn.amcharts.com/lib/editor/map/5/viewer.js"></script>2) A <div> element to be used as map’s container. We can define our own CSS to size and otherwise style it:
<div id="chartdiv" style="width: 100%; height: 600px;"></div>3) JavaScript code invoking the map viewer:
am5viewer.create("chartdiv", {
  // Map config
  // ...
});
Please note that am5viewer.create() function takes an id of its target container as the first parameter (in the above example "chartdiv").
Combining With Other amCharts Charts On The Same Page
Normally, viewer.js contains everything we need to run the maps, including amCharts 5 library and related files.
If we need to embed a map into a page that is already using amCharts 5 to create other charts, we can use a “lite” version of the viewer include: viewer.lite.js to make sure amCharts 5 is not loaded twice.
In this case we just need to ensure that all the amCharts 5 files needed to run our map are loaded:
<script src="https://cdn.amcharts.com/lib/5/index.js"></script>
<script src="https://cdn.amcharts.com/lib/5/map.js"></script>
<script src="https://cdn.amcharts.com/lib/5/plugins/json.js"></script>
<script src="https://cdn.amcharts.com/lib/5/plugins/exporting.js"></script>
<script src="https://cdn.amcharts.com/lib/5/geodata/worldLow.js"></script>
<script src="https://cdn.amcharts.com/lib/5/themes/Animated.js"></script>
<script src="https://cdn.amcharts.com/lib/editor/map/5/viewer.lite.js"></script>