Introducing Online Map Editor
This post looks at our Online Map Editor, what it can do, and how to do it.
Video Intro
What Can It Do?
We can use this tool to:
- Create world and regional/country maps
- Add lines, text labels, markers
- Animate markers
- Create data-bound heat maps and bubbles
- Create stylish pixelated maps
- Export as static image or embeddable code
- Save edits to local browser memory to load and continue editing later
Choosing a Map and a Projection
The tool starts with a World map in a Mercator projection pre-selected for us.
Besides the world map, the Map Editor has maps for most of the countries, as well as regional maps such as Continents, Europe, etc.
To choose a map, simply go to Settings:

For a world map, some projections might look better than others.
Switching a projection is done via Settings menu as well.
Please note, switching to a map for United States, will automatically switch projection to “Albers USA”.
Choosing Between Dark and Light Themes
While any color on the map can be edited manually, the Map Editor comes with two pre-set themes: Dark and Light.
Switch between them via Settings menu:

Switching a theme will reset all edits we have made so far, so it’s best to choose the theme right from the start, then stick with it.
Configuring the Appearance of the Map Polygons
We can change default coloring and outlines for map polygons (countries or states) by selecting the Polygons tool.
We can modify colors, as well as some other parameters for each polygon individually, too.
For that we can either click the polygon and select corresponding parameters from the window that opens, or use Fill tool.
Creating Heat-Maps and Bubbles
The Editor can also generate value-bound heat maps where each polygon is colored based on its value.
It can also use the same data to generate value-sized bubbles for each polygon.
Before we can use this feature, we need to provide data for each country or state via Data tool.
We can can enter values by hand, use random values, or – in case of world map – use some pre-set sample data sets.

Once the data is ready, we can use it to generate heat maps and bubbles.
To generate heat maps, let’s use Polygons tool.
In it we can change the color of the polygon with lowest value, and the color for the one with the highest value.
Additionally, we can set a “neutral color” for those polygons that do not have value in data.
Check “Apply heat rules” box, to apply the heat map coloring to the map.
To create bubbles, let’s use Bubbles tool.
We can choose the shape of a bubble, minimum and maximum size, color, and border.
Click “Generate” button when ready.

Once generated, each bubble can be clicked upon (or selected from the Map items list) and edited individually.
Creating Pixel Maps
Probably the most visually-stunning feature of the Map Editor is its ability to generate “pixel maps”.
When used, it replaces polygons with tightly packed shapes – pixels.
Let’s use it Pixels tool to generate one.
As usually, we will be able to choose some options like pixel shape and size, gaps between pixels, outline color and opacity.
Click “Generate” button when ready.
Adding Lines
To add lines, let’s select Lines tool.
Once there, we’ll be able to select multiple settings how the lines look, e.g. color, transparency, dashes as well as choose an icon to act as an anchor point for line elbows.
Optionally, we can also enter a label text to display next to the icons of the line.
When Lines tool is active, clicking anywhere on the map will start adding line-connected points.
We can change any setting while doing so and the it will be applied to subsequently added points/line segments.
If we ever want to come back to editing the line, we can select it from the Map items list.
Each line point is also editable by clicking directly on it.
We can also move points in line by simply dragging them.
Adding Markers
To start adding markers, let’s select Points tool.
Similarly to adding lines, once Points tool is active, clicking on a map will add a marker using currently selected parameters: point type, size, rotation, color, etc. as well as the label attached to it.
To edit current marker, simply click on it in the map or in the “Points” list.
To relocate a marker, simply drag it.
Normally, the markers are “pinned” to the map, so that when the map is moved or zoomed, the markers will move with it.
We can unpin them, so to create static icons.

Adding labels
To add labels, predictably use Labels tool.
Once Labels tool is active, clicking on a map will start adding labels on it using currently selected settings like label color, size, etc.

To edit a label, simply click on it in the map or in the Map items list.
For labels attached to a map point, we can also change alignment in relation to the marker itself.
Using a Resizer Tool
Most of the elements on the map are resizable.
Select Resize then start clicking on elements. Selected element will show a familiar resize bracket, which can be used to change the size of the element or rotate it quickly.
Downloading and Embedding
Once we’re done editing the map, we can download it as a static image, or as interactive code.
The Download tool offers a few options.
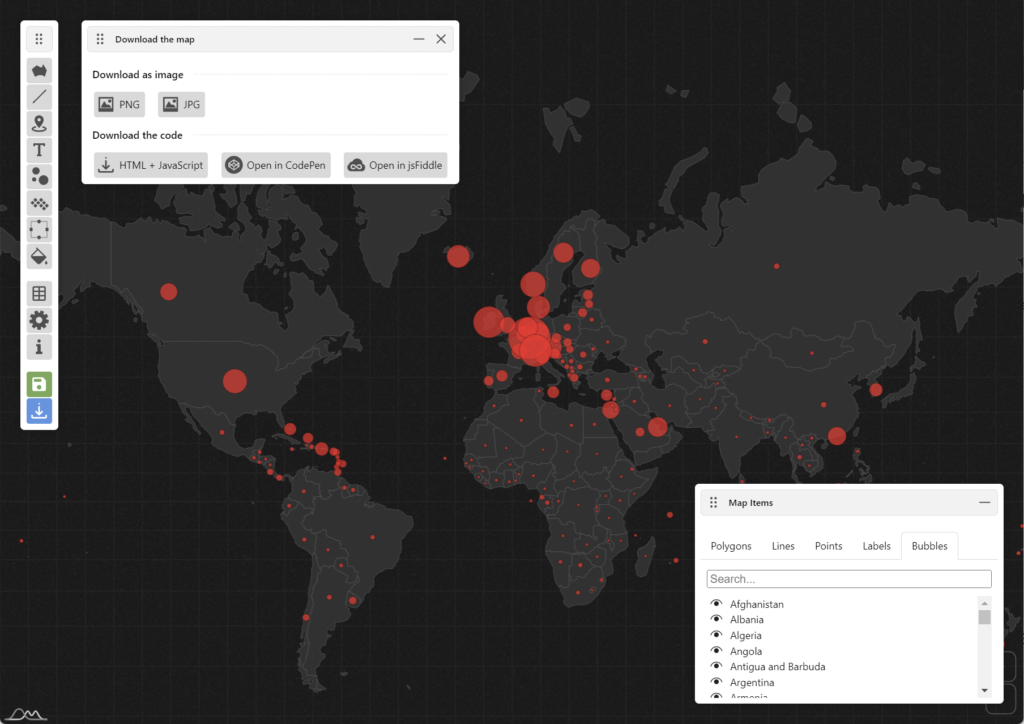
PNG and JPG downloads will produce a static image of the map.
HTML + JavaScript option will create an HTML file with full code to reproduce a fully interactive map, which you can embed via <iframe> or grab the code and paste into your own web app or CMS.
CodePen and jsFiddle will open map in those specific services, allowing you to dynamically tinker with the code and data.
Saving and restoring
Let’s open a Save map data tool.
It offers a couple of options for storing our current edits:
- Saving it to browser’s memory
Once we click on “Save map data” button, all current edits will be saved in browser’s “local storage” and loaded automatically when we come back to the editor the next time. - Exporting raw data
Clicking “Export data” will produce raw data for the edits and place it in the text box below. We can copy it and save whenever we want to store it, e.g. in a text file. When we want to restore the edits, we can paste the exported data in the same text box, then click “Import data”.
We can also completely reset the map to defaults using “Reset map” button at the bottom of the same window.
Advanced Usage
Make sure you go over to the following posts showcasing advanced usage of the Map Editor: