Saving and Restoring of Stock Chart’s Annotations
Stock Chart Annotations
Stock Chart by amCharts comes bundled with a lot of tools to annotate and analyze stock data – indicators and drawing tools.
Users can annotate the data displayed using wide array of tools from basic ones like lines and shapes and labels to complex like Fibonacci Retracement Levels and Regression lines.
They also have an ever-growing list of technical analytical tools, called indicators. They can be simple ones like Moving Average, or a complex but really useful ones like Volume Profile.
The issue is that those annotations are usually discarded when the page displaying the chart is reloaded, which brings us to a functionality that allows it to be retained.
Related tutorials
Saving to browser’s “local storage”
A browser’s local storage is a client-side storage mechanism that allows web applications to store and retrieve data locally on a user’s device. It provides a way for websites to store small amounts of data, such as user preferences or session information, persistently on the user’s browser. This data remains available even after the user closes the browser, enabling a more seamless and personalized user experience across visits to the same website.
amCharts Stock Chart provides built in ways to save all currently added indicators and drawings to local storage for those to be retained across page reloads and even sessions.
There are a couple of ways to do that.
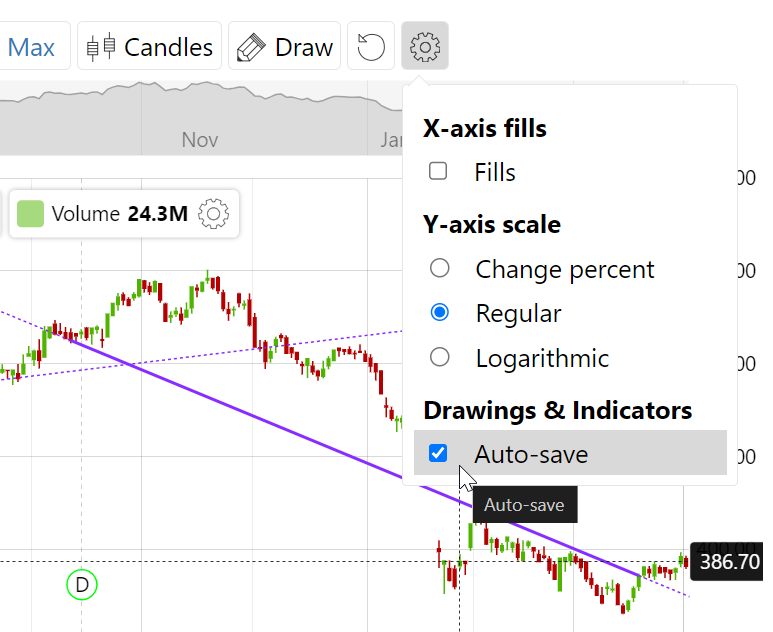
If the chart has a Settings Control added to its toolbar, it contains a checkbox, which allows automatic saving and restoring of all annotations.
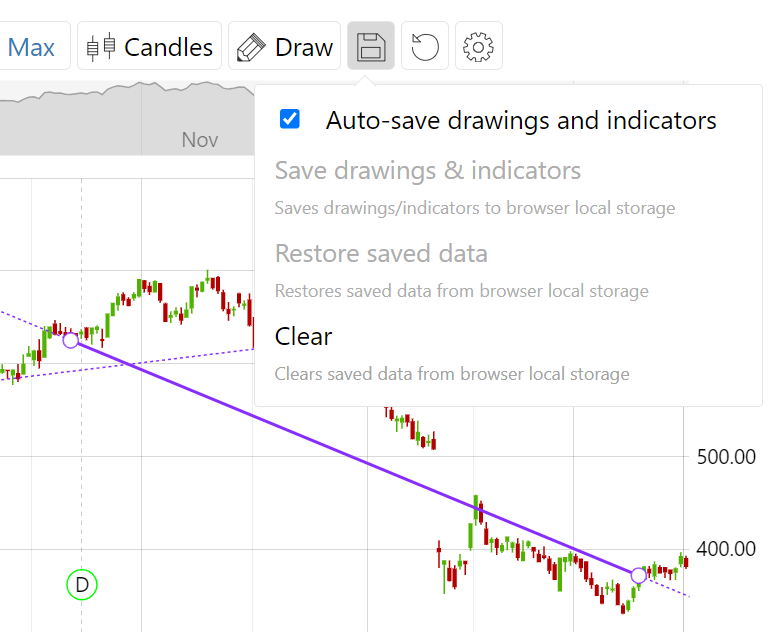
For more options, a Data Save Control can be added to the chart which, in addition to automatic save/restore – allows saving, restoring, and clearing annotation data manually.
Related documentation
Serializing annotations
Developers can offer more ways for their users to retain annotation data.
Stock Chart comes with an API to serialize all drawings and indicators into a JSON string, as well as parse and restore all those annotations.
As an example, serialized data can be transferred to server backend for storage into a data base.
Similarly, it can be loaded dynamically, and passed into chart’s API for parsing and restore of the annotations.