This short step-by-step tutorial will show how you can easily add charts and maps to your Weebly website.
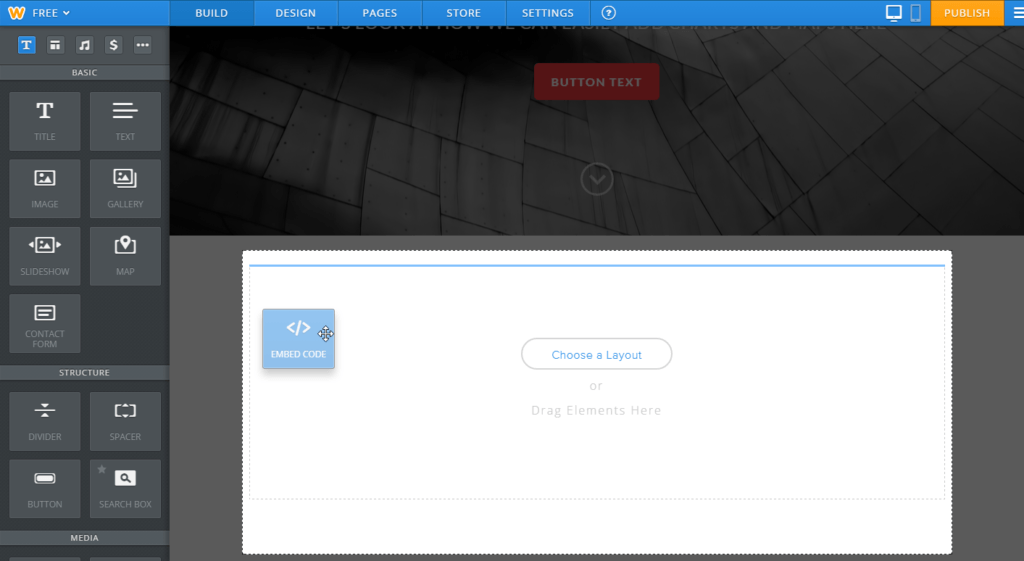
Step 1: add an EMBED CODE block
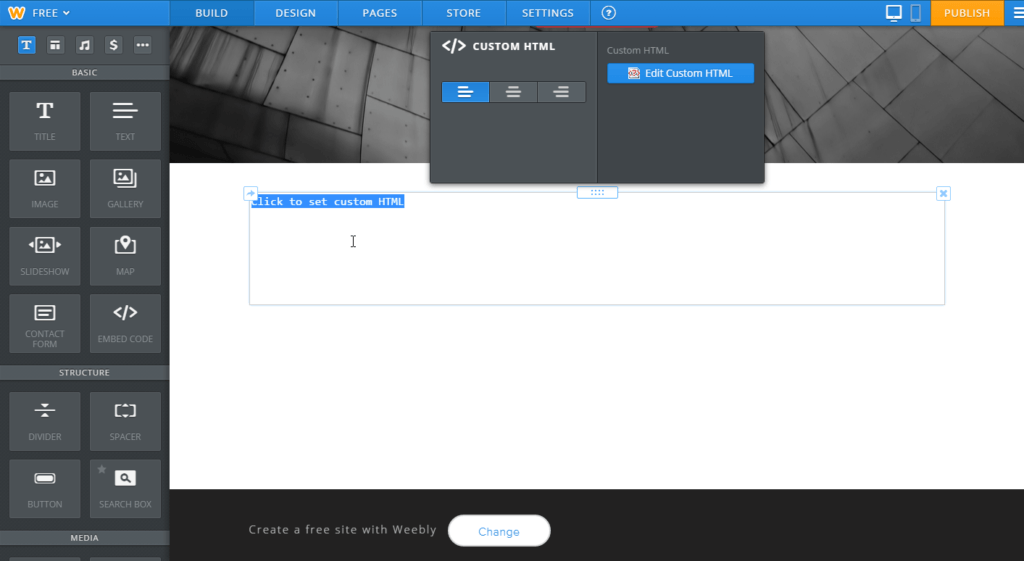
Step 2: Edit the block
Click on the block you just added to edit it.
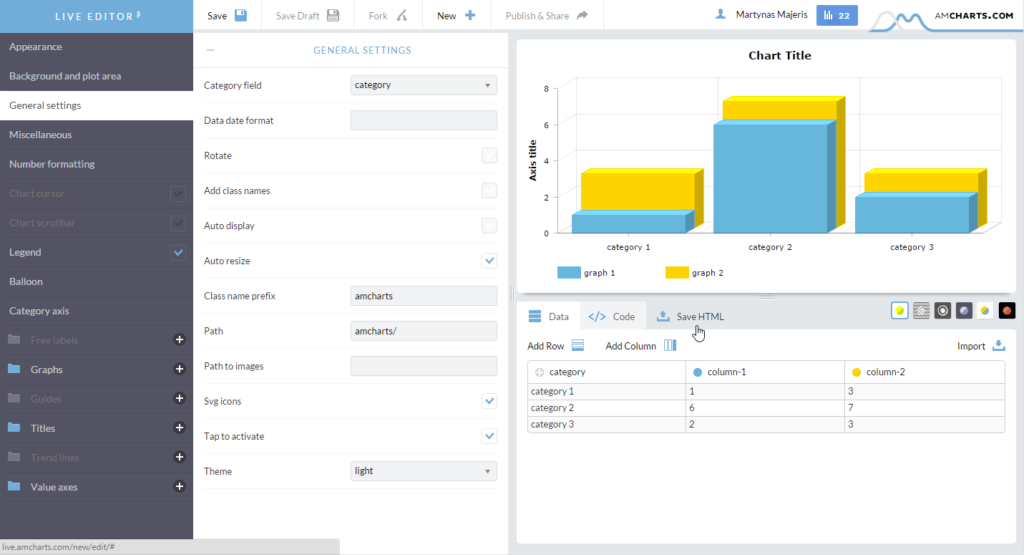
Step 3: Creating the chart code
If you already have your chart created somewhere, you’re good to go to Step 4.
If you don’t, we strongly recommend trying out our Live Editor, which will help you create the chart in a very user friendly way, without writing a single line of code.
Once you’re done in Editor, simply hit the “Save HTML” tab to generate the underlying code.
You’ll need to grab all <script> code as well as the HTML code container within the.
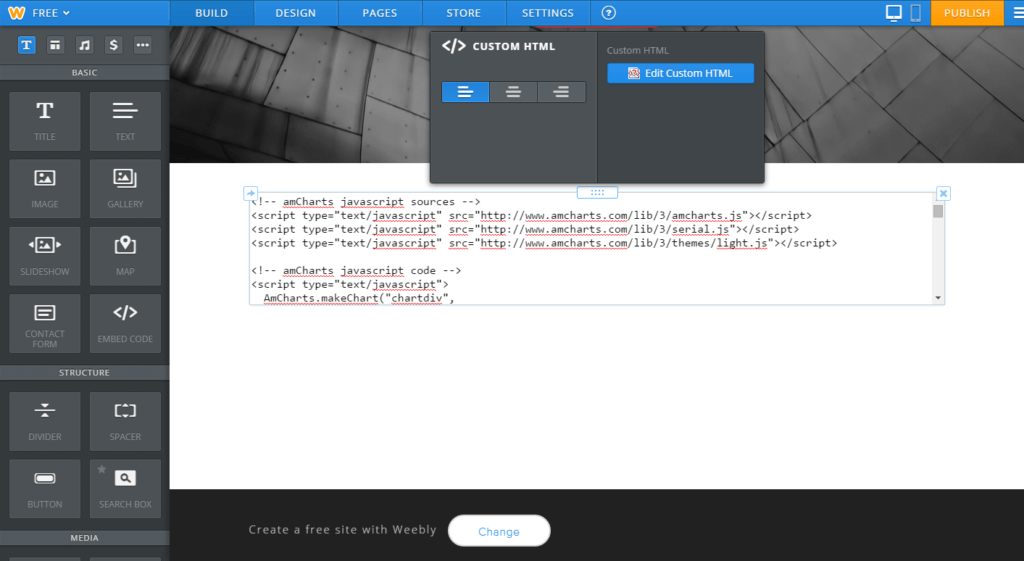
Step 4: Type in or paste in your chart code
Make sure the code contains all the required libraries,
container as well as JavaScript code for the chart itself, enclosed in <script> … </script> tags.
Step 5: Enjoy
And voila.
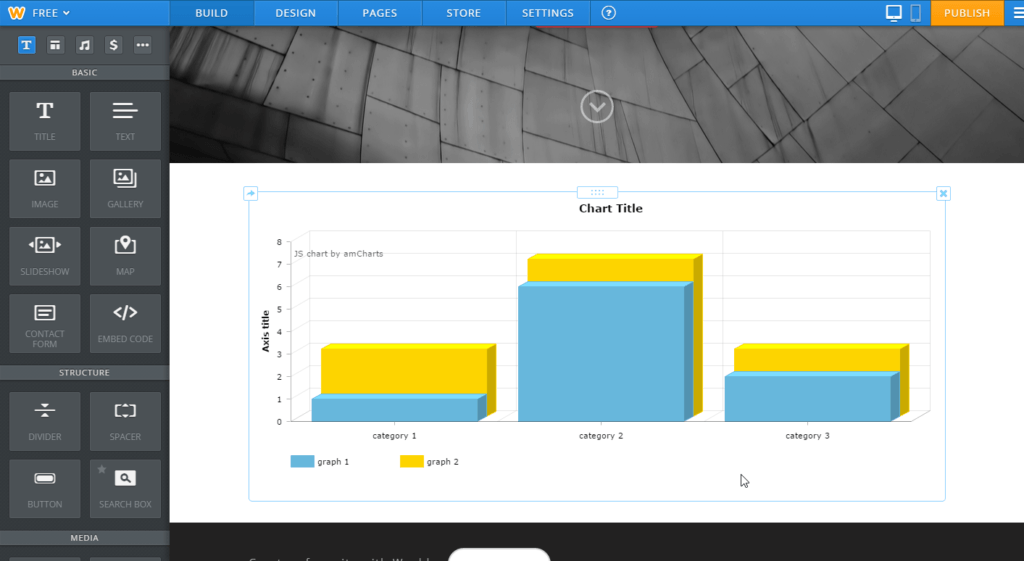
Here's the live Weebly website.
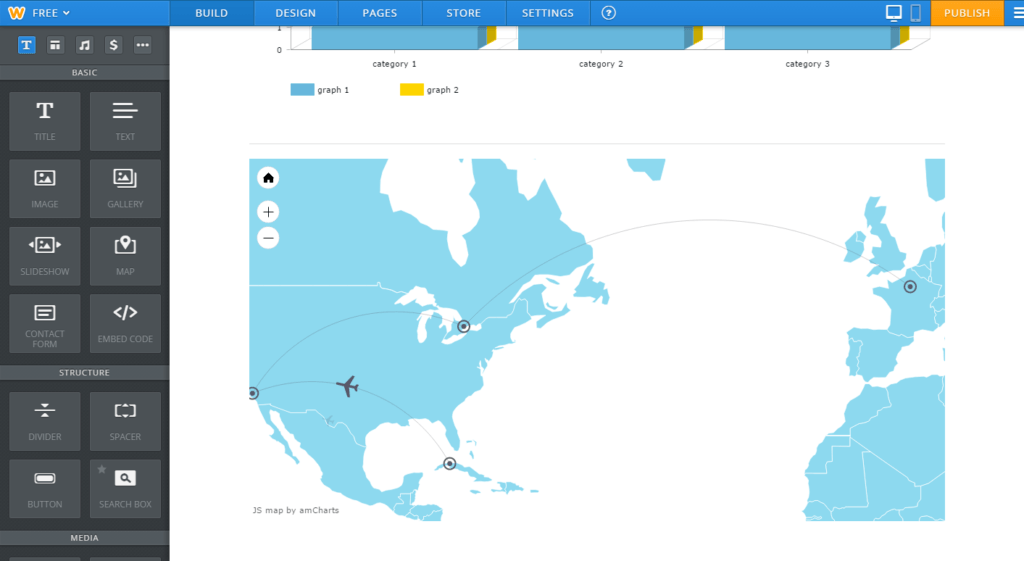
Adding more items
Now, just for the sake of it, let’s add a map too:
Important things to consider when having multiple chart or map instances per page
- Make sure the
containers that you create charts in have unique “id” property for each individual instance. I.e. “chart1”, “chart2”, “map1”, etc. The chart/map code needs to be updated accordingly as well: AmCharts.makeChart(“chart1”, …)
- When using maps and charts together, make sure you use ammap_amcharts_extension.js file instead of ammap.js