Intro
If you are looking on how to automatically generate PDF reports, you should probably explore some server-side options, like PhantomJS. We have a handy tutorial ready about the latter here.
However, sometimes, you just need to export a chart or two, along with some additional info on-demand, triggered by the user. In those cases you can use our own Export plugin.
This article provides instructions on how to set up your export to do just that.
If you're not a big fan of reading a lot of text, jump to the bottom of this article. It contains a link to a full working chart that we are going to build during the course of the tutorial.
Prerequisites
We assume that you are familiar with Export plugin. If you're not, we suggest you start here.
For any of the below technique to work, Export plugin must be loaded on the web page. Each chart to be exported should also have "export" option enabled, i.e. contain Export plugin configuration block:
"export": {
  "enabled": true,
  "menu": []
}
Empty "menu" array means the plugin is active, but it will not show its export button.
Test report
Let's say we have something like this as a report page:
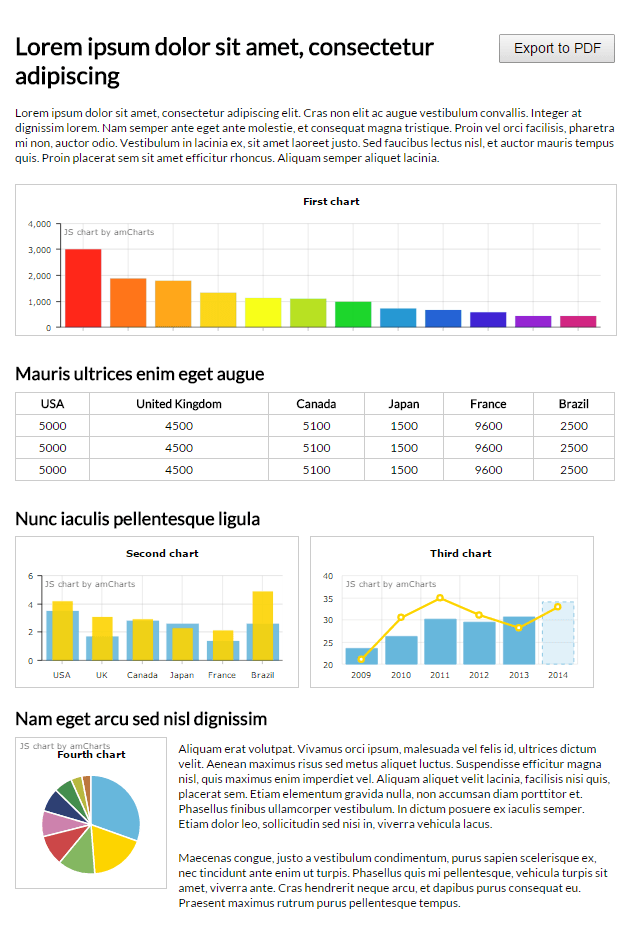
When user clicks "Export PDF", I want something similar to be dumped into a PDF, which then user can save on his or her computer.
Say, the button will execute a custom function:
function exportReport() {
  console.log("Starting export...");
}
We're going to continue building up this function, placing the code that does actual export in there.
Step #1: Exporting the charts to images
Since PDF can't contain dynamic content like JavaScript, we'll need to grab each and every chart we want to export as a bitmap image representation of their current states.
We're going to be using Export plugin's "toPNG()" function.
One thing to note is that "toPNG()" function is asynchronous. Meaning that we will need their completion handler functions to grab the output as well as check the total number of exported charts, so that we know we have all of them and can move on to the next step.
Here's how this might look code-wise:
function exportReport() {

  // So that we know export was started
  console.log("Starting export...");

  // Define IDs of the charts we want to include in the report
  var ids = ["chartdiv1", "chartdiv2", "chartdiv3", "chartdiv4"];

  // Collect actual chart objects out of the AmCharts.charts array
  var charts = {}
  var charts_remaining = ids.length;
  for (var i = 0; i < ids.length; i++) {
    for (var x = 0; x < AmCharts.charts.length; x++) {
      if (AmCharts.charts[x].div.id == ids[i])
        charts[ids[i]] = AmCharts.charts[x];
    }
  }

  // Trigger export of each chart
  for (var x in charts) {
    if (charts.hasOwnProperty(x)) {
      var chart = charts[x];
      chart["export"].capture({}, function() {
        this.toPNG({}, function(data) {

          // Save chart data into chart object itself
          this.setup.chart.exportedImage = data;

          // Reduce the remaining counter
          charts_remaining--;

          // Check if we got all of the charts
          if (charts_remaining == 0) {
            // Yup, we got all of them
            // Let's proceed to putting PDF together
            generatePDF();
          }

        });
      });
    }
  }

  function generatePDF() {

    // Log
    console.log("Generating PDF...");

  }
}
Once this run, we will have all four of our chart objects, in a neat "charts" object, with their static bitmap representations stored in their respective "exportedImage" properties.
For the sake of structural clarity, we will declare a new local function "generatePDF()" that will be executed once our remaining charts counter hits zero.
Step #2: Putting the PDF together
Now that we have all of our charts as images, we might start layouting a PDF. Once all of the charts are exported to images, our code will execute "generatePDF" function, which will do the grunt work.
Export plugin uses an excellent library - pdfmake. It allows adding various objects into a "layout" object, which can then be rendered into a PDF document.
Complete information of what can go into a pdfmake layout is here.
We're going to be using just a few of the available layout and formatting options. Use the link above to find out how much more you can cram into a PDF using this library.
OK, so for starters we initialize an empty layout object. The actual content objects that goe into PDF is contained in layout's "content" property:
var layout = {
  "content": []
}
Now let's start adding actual content objects.
Adding text
The most basic object is text. Let's add a title and intro text:
// Let's add a custom title
layout.content.push({
  "text": "Lorem ipsum dolor sit amet, consectetur adipiscing",
  "fontSize": 15
});

// Now let's grab actual content from our
intro tag layout.content.push({ "text": document.getElementById("intro").innerHTML; });
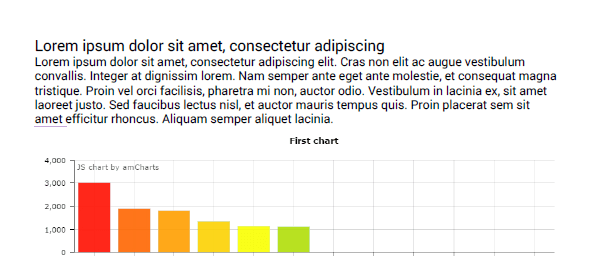
Now, if I exported PDF as it is, I'd get a document that would look something like this:

Adding images
That's a good start. Now let's add our first chart.
We're going to use image type object in out layout:
layout.content.push({
  "image": charts["chartdiv1"].exportedImage,
  "fit": [ 523, 300 ]
});
Notice the "fit" parameter. It's a special pdfmake parameter telling it to downsize the image to 523x300 pixels if it does not fit.
OK, so here's what we would get now:
Our report is really coming together.
Adding tables
pdfmake allows adding tables to PDF as well:
layout.content.push({
  "table": {
    // headers are automatically repeated if the table spans over multiple pages
    // you can declare how many rows should be treated as headers
    "headerRows": 1,
    "widths": ["16%", "16%", "16%", "16%", "16%", "*"],
    "body": [
      ["USA", "UK", "Canada", "Japan", "France", "Brazil"],
      ["5000", "4500", "5100", "1500", "9600", "2500"],
      ["5000", "4500", "5100", "1500", "9600", "2500"],
      ["5000", "4500", "5100", "1500", "9600", "2500"]
    ]
  }
});
Organizing information into columns
Now, let's put our two other charts side by side. We'll need to put those into columns.
layout.content.push({
  "columns": [{
    "width": "50%",
    "image": charts["chartdiv2"].exportedImage,
    "fit": [250, 300]
  }, {
    "width": "50%",
    "image": charts["chartdiv3"].exportedImage,
    "fit": [250, 300]
  }]
});
Each column is an array which can hold other objects. Just like the main layout file.
Please refer to the pdfmake documentation for description of "width".
We'll use columns to add our last chart and text duo as well:
layout.content.push({
  "columns": [{
    "width": "25%",
    "image": charts["chartdiv4"].exportedImage,
    "fit": [125, 300]
  }, {
    "width": "*",
    "stack": [
      document.getElementById("note1").innerHTML,
      "nn",
      document.getElementById("note2").innerHTML
    ]
  }],
  "columnGap": 10
});
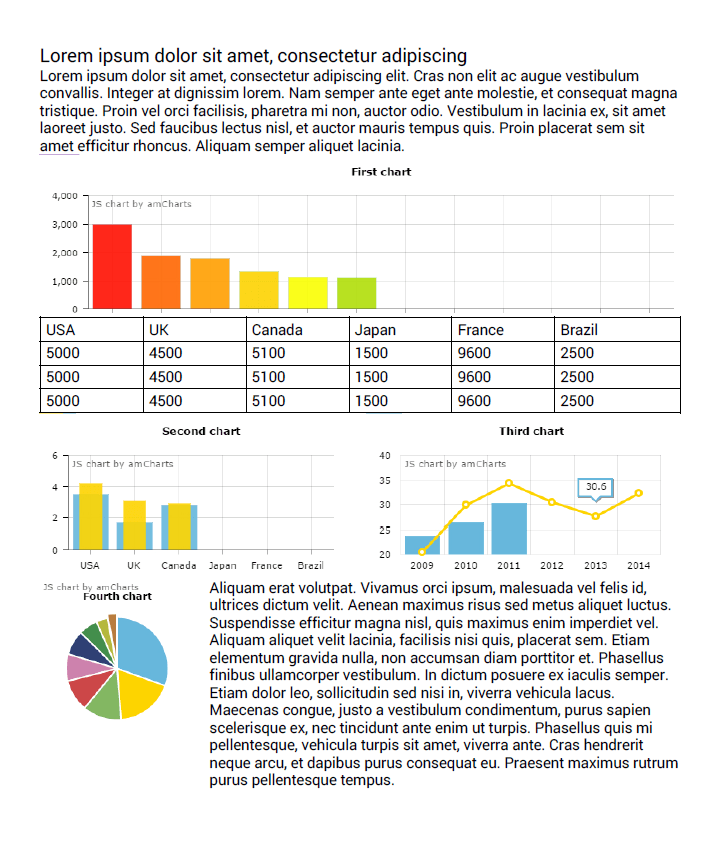
And here we go:
Conclusion
The final PDF document could use some styling, like borders and margins around paragraphs. We'll leave you to pdfmake documentation to apply those.
The final working example of the above report can be found here.
If you have questions, drop as a line on contact@amcharts.com.