Starting with version 3.13 amCharts has introduced a plugin which allows transparently enabling responsive features of the charts and maps.
Compatible with all amCharts products - JavaScript Charts, JavaScript Stock Chart and JavaScript Maps - this plugin dynamically scales-down and -up chart's visual features to best suit available viewport.
This article deals on how to enable and tweak the plugin behavior.
What "amCharts Responsive" does?
"Responsive" chart or map will modify it's features dynamically (even as you resize the container) based on the available area. For example: a full fledged line chart with legend guides, labels, titles and other elements will be displayed in all its glory if container is big enough.
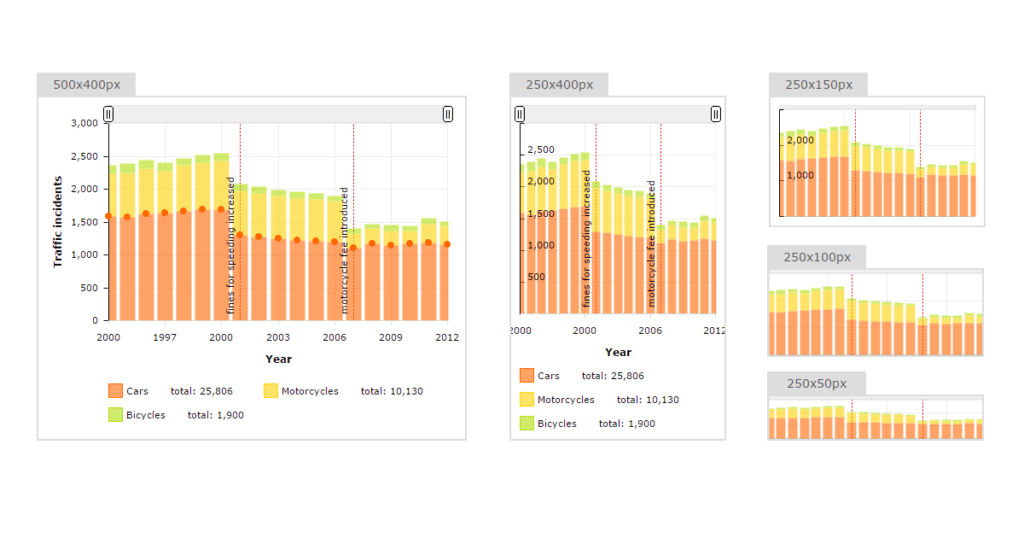
If the container shrinks (i.e. you resize a browser window or view it on an iPad), it starts "compacting" the chart. First the legend is removed. Shrink it even further, axis titles are removed and its value labels are moved inside the plot area. Going even smaller, bullets, labels gone. All the way to the sparkline representation of the chart.
Plugin brings a universal set of pre-defined rules that you can use to instantly enable responsiveness. Those are custom-tailored for each chart/map type and
will probably fit your requirements out-of the-box. All you need to do is to enable "responsive" plugin for your chart instance. You can modify those defaults rules, or make your own list. The plugin allows that. (see further down this file for instructions)
Example?
Here's a live example that will help you get a feeling of what responsive charts are all about.
Where do I get it?
Starting with v3.13, the plugin is bundled with all amCharts products. (Please note that the plugin will not work on any earlier versions of amCharts products)
You can also get the latest build directly from its GitHub repository:
https://github.com/amcharts/responsive
Enabling responsive features
1. Include the minified version of file of this plugin. I.e.:
<script src="amcharts/plugins/responsive/responsive.min.js" type="text/javascript"></script>
(this needs to go after all the other amCharts includes)
2. Add the following setting to your chart configuration:
AmCharts.makeChart( "chartdiv", {
  ...,
  "responsive": {
    "enabled": true
  }
} );
Or if you are using non-JSON setup:
chart.responsive = {
  "enabled": true
};
That's it.
Advanced use
Rules
You can modify (or completely overwrite) the default responsive rules used by the plugin.
A plugin works by checking chart area dimensions after each resize. (or after initial build / mobile device orientation change) It then overrides particular settings suitable for these particular dimensions.
Override rules are implemented by defining chart rules, or just "rules" moving forward. Each rule has two things:
1. Dimension conditions;
2. Overrides. (a set of properties to override for this particular rule)
A rule is an object, for example:
{
  "minWidth": 200,
  "maxWidth": 400,
  "maxHeight": 400,
  "minHeight": 200,
  "overrides": {
    "precision": 2,
    "legend": {
      "enabled": false
    },
    "valueAxes": {
      "inside": true
    }
  }
}
The above rule will be applicable to a chart that is between 200px and 400px in width and height.
It is not necessary to add all of the dimensional properties. You just neat at least one.
So for example to make the rule apply to all charts with width 400px or lower, you would do something like this:
{
  "maxWidth": 400,
  "overrides": {
    "precision": 2,
    "legend": {
      "enabled": false
    },
    "valueAxes": {
      "inside": true
    }
  }
}
Please note that there are several other conditional properties besides the ones that deal with chart's dimensions:
- rotate (true|false) - set this property if you want to make this rule applicable to rotated serial chart only (i.e. bar chart)
- legendPosition ("top|bottom|left|right") - set this property if you want the rule applied only when the chart legend is set to particular position. Please note that this does not check whether the legend is enabled at all.
Now, on to explaining "overrides". It's an object, that contains properties that you want to override the chart's initial ones with.
It can be either simple properties, like fontSize or "precision", or complex types like object, or array.
To override a property of a child object, such as "legend", you would simply go with JSON representation of the properties you need to override. I.e.:
"legend": {
  "enabled": false
}
This will look for a legend property in chart object, then change it's enabled property to false.
Overriding arrays of objects
Some objects in charts are collected in arrays, i.e. graphs, valueAxes, etc.
There are some ways to override their properties as well.
To override properties for ALL objects in the array, you would provide an override instruction as an object. I.e.:
"graphs": {
  "bullet": "round",
  "lineThickness": 5
}
The above will add a round bullet and set line thickness to all of the graphs on the chart.
You can also target individual items in the array. There are two ways to do that:
a) Use id property;
b) Apply using the same index.
To individually apply property overrides, you will need to supply override instructions as an array:
"graphs": [
  {
    "id": "g1",
    "bullet": "round",
    "lineThickness": 5
  }
]
The above will apply the same properties for the graph with an id of "g1" only. It will not touch the rest of the graphs.
Please note that original graph definition in your chart settings needs to have the id property set so this plugin can target it.
Or you can omit the id and just apply overrides in the same order as you have them defined. I.e.:
"graphs": [
  {
    "bullet": "round"
  },
  {
    "bullet": "square"
  }
]
The above will apply round bullets to the first defined graph, and square bullets to the second graph.
Chaining multiple rules
The cool pat is that you can daisy-chain the override rules, much like in CSS.
The plugin will examine all of the rules if their dimensional conditions match current chart condition and will apply their overrides in the same order they are defined.
Consider this rule set:
"responsive": {
  "enabled": true,
  "rules": [
    // at 400px wide, we hide legend
    {
      "maxWidth": 400,
      "overrides": {
        "legend": {
          "enabled": false
        }
      }
    },

    // at 300px or less, we move value axis labels inside plot area
    // the legend is still hidden because the above rule is still applicable
    {
      "maxWidth": 300,
      "overrides": {
        "valueAxes": {
          "inside": true
        }
      }
    },

    // at 200 px we hide value axis labels altogether
    {
      "maxWidth": 200,
      "overrides": {
        "valueAxes": {
          "labelsEnabled": false
        }
      }
    }

  ]
}
In case several rules modify the same property, the last one will always "win".
Combining custom rules with pre-defined ones
The plugin will combine your custom rules with pre-defined ones automatically.
In case you want to go pure and set only your own responsive rules, you can set property addDefaultRules to false. I.e.:
"responsive": {
  "enabled": true,
  "addDefaultRules": false,
  "rules": [
    {
      "maxWidth": 400,
      "overrides": {
        "legend": {
          "enabled": false
        }
      }
    }
  ]
}
When your custom rules are combined with pre-defined ones, yours are appended at the end of the list. This means that your rules will always have the "last word".