IMPORTANT NOTICE! The information provided in this article is here for historical reference. We strongly suggest you consider using our official Data Loader plugin, which takes care of all the data loading automatically. However, bits and pieces of this article might still be useful for some. Please refer to this tutorial for further information.
The purpose of this article is to show you how you can hook up your client-side charts to the database servers on your back end using server-side scripting languages.
We’ll be using MySQL and PHP. However the principles outlined in this article will be applicable to any combination of server-side technologies, like ASP.NET+MSSQL, etc.
We’re gonna follow this natural progression:
- Create and populate sample MySQL table, that we will be using for tests.
- Create PHP scripts, that load data off the DB server and generate data suitable, for charts.
- Implement a plain vanilla JavaScript data loader to load the data from the server.
- Hook it all together to a working serial chart prototype.
#1: The database
For testing purposes, I’m going to create a very basic 3 column database table "my_chart_data": 1 column for category and 2 value columns. I’m also going to populate it with some random data:
CREATE TABLE IF NOT EXISTS `my_chart_data` (
  `category` date NOT NULL,
  `value1` int(11) NOT NULL,
  `value2` int(11) NOT NULL
);
Then we’ll populate with some data:
INSERT INTO `my_chart_data` (`category`, `value1`, `value2`) VALUES
('2013-08-24', 417, 127),
('2013-08-25', 417, 356),
('2013-08-26', 531, 585),
('2013-08-27', 333, 910),
('2013-08-28', 552, 30),
('2013-08-29', 492, 371),
('2013-08-30', 379, 781),
('2013-08-31', 767, 494),
('2013-09-01', 169, 364),
('2013-09-02', 314, 476),
('2013-09-03', 437, 759);
#2: Generating the data
In this step we’re going to create a PHP script that connects to MySQL server, loads the data and outputs the data in JSON format, which is a de facto standard for JavaScript-based applications.
<?php
// Connect to MySQL
$link = mysql_connect( 'localhost', 'root', '' );
if ( !$link ) {
  die( 'Could not connect: ' . mysql_error() );
}

// Select the data base
$db = mysql_select_db( 'test', $link );
if ( !$db ) {
  die ( 'Error selecting database 'test' : ' . mysql_error() );
}

// Fetch the data
$query = "
  SELECT *
  FROM my_chart_data
  ORDER BY category ASC";
$result = mysql_query( $query );

// All good?
if ( !$result ) {
  // Nope
  $message  = 'Invalid query: ' . mysql_error() . "n";
  $message .= 'Whole query: ' . $query;
  die( $message );
}

// Print out rows
while ( $row = mysql_fetch_assoc( $result ) ) {
  echo $row['category'] . ' | ' . $row['value1'] . ' | ' .$row['value2'] . "n";
}

// Close the connection
mysql_close($link);
?>
This prints out the data from our table nicely:
2013-08-24 | 417 | 127
2013-08-25 | 417 | 356
2013-08-26 | 531 | 585
2013-08-27 | 333 | 910
2013-08-28 | 552 | 30
2013-08-29 | 492 | 371
2013-08-30 | 379 | 781
2013-08-31 | 767 | 494
2013-09-01 | 169 | 364
2013-09-02 | 314 | 476
2013-09-03 | 437 | 759
That’s nice, but that’s not JSON, we’re aiming for. Let’s modify our script to produce a valid JSON output:
// Print out rows
$prefix = '';
echo "[n";
while ( $row = mysql_fetch_assoc( $result ) ) {
  echo $prefix . " {n";
  echo '  "category": "' . $row['category'] . '",' . "n";
  echo '  "value1": ' . $row['value1'] . ',' . "n";
  echo '  "value2": ' . $row['value2'] . '' . "n";
  echo " }";
  $prefix = ",n";
}
echo "n]";
Now it produces a nicely formatted, valid JSON data:
[{
  "category": "2013-08-24",
  "value1": 417,
  "value2": 127
}, {
  "category": "2013-08-25",
  "value1": 417,
  "value2": 356
}, {
  "category": "2013-08-26",
  "value1": 531,
  "value2": 585
}, {
  "category": "2013-08-27",
  "value1": 333,
  "value2": 910
}, {
  "category": "2013-08-28",
  "value1": 552,
  "value2": 30
}, {
  "category": "2013-08-29",
  "value1": 492,
  "value2": 371
}, {
  "category": "2013-08-30",
  "value1": 379,
  "value2": 781
}, {
  "category": "2013-08-31",
  "value1": 767,
  "value2": 494
}, {
  "category": "2013-09-01",
  "value1": 169,
  "value2": 364
}, {
  "category": "2013-09-02",
  "value1": 314,
  "value2": 476
}, {
  "category": "2013-09-03",
  "value1": 437,
  "value2": 759
}]
Let’s go and verify the output if it’s a valid JSON. Yup, it is.
#3: Loading the data in browser via JavaScript
I’m going to create data loader functions in the AmCharts namespace, so to avoid any potential conflicts with your and 3rd party JavaScript code.
Let’s create a function that first loads the target URL data then parses it. Please note that JSON is essentially JavaScript, so we’re just going to use eval() function to “parse” the data.
AmCharts.loadJSON = function(url) {
  // create the request
  if (window.XMLHttpRequest) {
    // IE7+, Firefox, Chrome, Opera, Safari
    var request = new XMLHttpRequest();
  } else {
    // code for IE6, IE5
    var request = new ActiveXObject('Microsoft.XMLHTTP');
  }

  // load it
  // the last "false" parameter ensures that our code will wait before the
  // data is loaded
  request.open('GET', url, false);
  request.send();

  // parse and return the output
  return eval(request.responseText);
};
NOTE: Make sure this code is executed after the amcharts.js library is included, so the AmCharts object is already available.
Now let’s start building out the chart code by using the above function:
 AmCharts.ready(function() {
   // load the data
   var chartData = AmCharts.loadJSON('data.php');

   // this is a temporary line to verify if the data is loaded and parsed correctly
   // please note, that console.debug will work on Safari/Chrome only
   console.debug(chartData);

   // build the chart
   // ...
 });
Let’s check browser’s console:
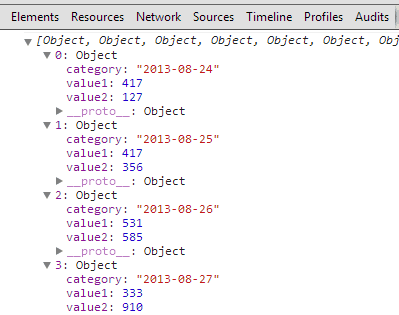
Beautiful!
NOTE #2: Due to JavaScript security restrictions, the above function will not work if you load the page locally (via file:///). You need to have it loaded via web server (http://)
#4: Build a fully functional chart using loaded data
Here’s the full code for the chart:
var chart;

// create chart
AmCharts.ready(function() {

  // load the data
  var chartData = AmCharts.loadJSON('data.php');

  // SERIAL CHART
  chart = new AmCharts.AmSerialChart();
  chart.pathToImages = "http://www.amcharts.com/lib/images/";
  chart.dataProvider = chartData;
  chart.categoryField = "category";
  chart.dataDateFormat = "YYYY-MM-DD";

  // GRAPHS

  var graph1 = new AmCharts.AmGraph();
  graph1.valueField = "value1";
  graph1.bullet = "round";
  graph1.bulletBorderColor = "#FFFFFF";
  graph1.bulletBorderThickness = 2;
  graph1.lineThickness = 2;
  graph1.lineAlpha = 0.5;
  chart.addGraph(graph1);

  var graph2 = new AmCharts.AmGraph();
  graph2.valueField = "value2";
  graph2.bullet = "round";
  graph2.bulletBorderColor = "#FFFFFF";
  graph2.bulletBorderThickness = 2;
  graph2.lineThickness = 2;
  graph2.lineAlpha = 0.5;
  chart.addGraph(graph2);

  // CATEGORY AXIS
  chart.categoryAxis.parseDates = true;

  // WRITE
  chart.write("chartdiv");
});
And here’s, Ladies and Gentlemen, the final output:
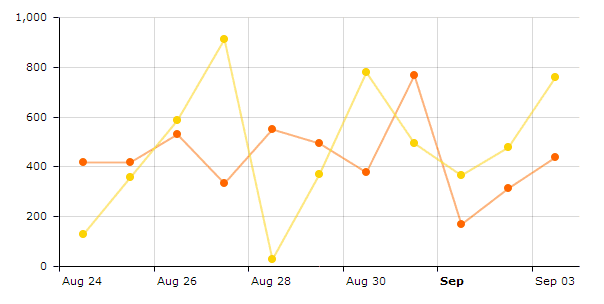
If you’re not big on copying and pasting the code, you can download the complete working example with all the files used in this tutorial here: tutorial_assets_external-data.zip