We have many articles and examples here on amcharts.com that deal with theoretical concepts of loading remote data to be shown on charts.
This tutorial will differ in such way that it will use the real data and the real data feed.
If you’d like to review the principles, here are a few articles to get you started:
- Using Data Loader to connect charts to MySQL data base
- Using Data Loader plugin to load external data in CSV or JSON formats
If you’re not interested in nitty gritty details, and want just jump in and make it happen, read on.
Choosing a data provider
While there is a number of financial data providers out there, we here at amCharts find FinancialContent to be our go-to choice for financial data.
FinancialContent and CloudQuote
Before jumping in deeper, let’s explain how stuff works.
FinancialContent is a leading provider of financial data for websites & apps.
CloudQuote - which we will be using in this tutorial - is a marketplace created by FinancialContent which allows easy one-stop access to various financial and market-related datasets, including the ones from FinancialContent itself.
CloudQuote is a usage based service. Certain data requires a paid subscription.
Please contact CloudQuote directly for further information about pricing and other conditions.
The advantages of using CloudQuote
CloudQuote provides on-demand access to live and historical financial data from numerous sources of stock market data, with crystal clear description of their APIs, choice of formats such as JSON, XML, and CSV, with straightforward pricing.
As a plus, most of CloudQuote financial info feeds are compatible with amCharts libraries out of the box with very little configuration needed on your end to make them work.
Other 3rd party data providers
That being said, while for the purpose of this tutorial we will be using CloudQuote and their APIs, the same principles may apply to other providers with little or no modification.
Important: Data feed load restrictions
In this tutorial we are using CloudQuote’s sample data APIs. They won’t work outside of the amCharts CodePen examples provided in this tutorial.
Please note that CloudQuote is a paid service. To subscribe for their services, please use this form.
There are a few ways to access data from CloudQuote. You can build a data "proxy" on your web server, which loads data from CloudQuote and outputs it, so that it can be loaded from the same host as the web page with charts. This approach helps in avoiding any cross-domain (CORS) data loading restrictions, but introduces a slight overhead for the additional step.
Another approach, which we will be using in this article, is loading data from client-side charts directly from CloudQuote servers. Loading data from other host (domain name) then the web page currently being viewed is subject to cross-domain policy (or CORS). By default, browsers will reject such data calls.
To work around that, you will need to set up CORS policies in CloudQuote. To do that, go to My Account > API credentials.
Probably the easiest way to get rolling is to "whitelist" a domain name for your website. The calls from data loads from the whitelisted domain will not be blocked by your browser.
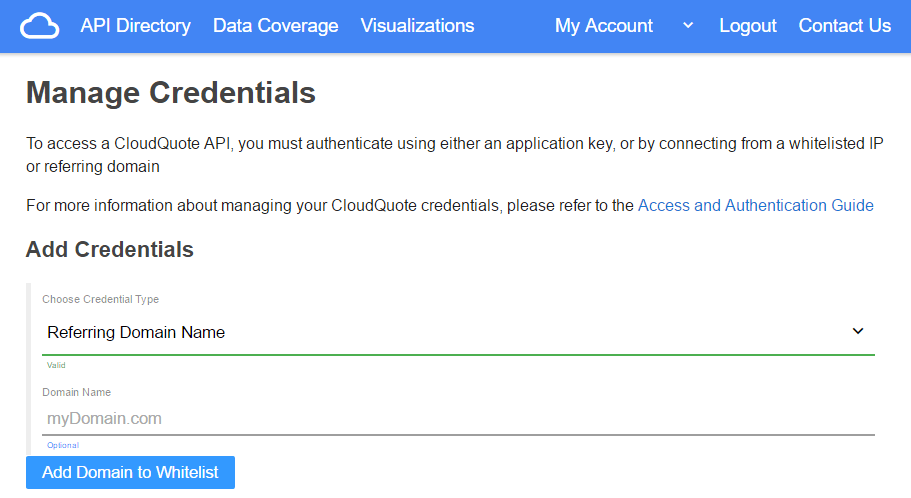
For more information about setting up API credentials, refer to this CloudQuote document.
Introduction to Data Loader plugin
Loading of external data in amCharts is done with the help of our Data Loader plugin. It allows replacing the dataProvider property of the chart or data set with a dataLoader directives with instructions on where to load data from.
Data Loader supports data sources in JSON and CSV formas, both of which (among other) are offered as options in all CloudQuote feeds.
For more information on how Data Loader works, visit the two tutorials linked at the beginning of this page. Further down, we will provide only details required for the specific needs of the examples.
Selecting an appropriate API
CloudQuote offers a number of different time-series APIs that will give you access to different data, such as:
getHistory&getStockPriceHistoryfor retrieving end-of-day historical stock pricesgetHistory&getStockTickHistoryfor retrieving one-minute bars of intraday stock datagetEquityOptionsHistoryfor retrieving end-of-data historical options pricesgetDailyBitcoinLiquidIndexfor retrieving end-of-day bitcoin pricinggetRealtimeBitcoinLiquidIndexfor retrieving real-time bitcoin pricinggetRatingsByDatefor retrieving analyst ratings for a security
Basic principles of loading external data
The loading of data in amCharts is achieved by using dataLoader directive in chart’s config.
Before you can use Data Loader, make sure it is loaded along other amCharts includes. I.e.:
<script src="//www.amcharts.com/lib/3/amcharts.js"></script>
<script src="//www.amcharts.com/lib/3/serial.js"></script>
<script src="//www.amcharts.com/lib/3/themes/light.js"></script>
<script src="//www.amcharts.com/lib/3/plugins/dataloader/dataloader.min.js"></script>
To instruct Data Loader to load external data, replace dataProvider in your chart or data set config with dataLoader. I.e.:
"dataLoader": {
  "url": "https://api.cloudquote.net/fcon/getStockTickHistory.json?symbol=MSFT"
}
You need at least url parameter, which specifies where to load data form.
By default the plugin will expect data in JSON format.
To specify a different data format (i.e. CSV), you would use format parameter. For CSV, you will also need to specify some other information, like separator symbol, etc.:
"dataLoader": {
  "url":
  "https://api.cloudquote.net/fcon/getStockPriceHistory.csv?symbol=AAPL&from=2010-01-01",
  "format": "csv",
  "delimiter": ",",
  "useColumnNames": true,
  "numberFields": [ "Date" ]
}
We will not go into details about available parameter in this tutorial. For more information visit Data Loader documentation.
The above config changes are enough to trigger Data Loader to load the data before the chart is created.
Pre-processing JSON data
amCharts libraries expect loaded data to be a list of data points. For CloudQuote CSV feeds it’s already the case, so no additional processing is needed.
For JSON format, it’s not the case.
The returned JSON object contains two top-level properties:
{
  "rows": [...],
  "columns": [...]
}
Therefore we will need to use Data Loader’s data pre-processing capabilities to change the loaded data in the format that will be "consumable" to amCharts.
For this we will be use Data Loader’s postProcess parameter. It takes a JavaScript function that gets a raw data that just been loaded and returns data that will be used as amCharts’ data.
"dataLoader": {
  "url": "https://api.cloudquote.net/fcon/getStockTickHistory.json?symbol=MSFT",
  "format": "json",
  "postProcess": function(data, config, chart) {
    return data.rows;
  }
}
The above will return an array of data points that is technically suitable for amCharts.
However, each data point is an array of values. So you would need to reference to particular fields using numeric index. I.e. "0" for timestamp, "1" for value, etc.
[
  [ 1485441061000, 64.190002, 821655 ],
  [ 1485441062000, 64.139999, 1036384 ],
  [ 1485441063000, 64.235001, 1254689 ],
  // ...
]
That’s not very descriptive and reliable, so we might enhance our pre-processing function to use columns property of the response to create properly mapped objects, with proper field names.
"dataLoader": {
  "url": "https://api.cloudquote.net/fcon/getStockTickHistory.json?symbol=MSFT",
  "format": "json",
  "postProcess": function( data, config, chart ) {
    var newData = [];
    for ( var i = 0; i < data.rows.length; i++ ) {
      var dataPoint = {};
      for ( var c = 0; c < data.columns.length; c++ ) {
        dataPoint[ data.columns[ c ] ] = data.rows[ i ][ c ];
      }
      newData.push( dataPoint );
    }
  }
}
Now we get nicely formatted data like this:
[ {
  "Time": 1485441061000,
  "Price": 64.190002,
  "Volume": 821655
}, {
  "Time": 1485441122000,
  "Price": 64.139999,
  "Volume": 1036384
}, {
  "Time": 1485441183000,
  "Price": 64.235001,
  "Volume": 1254689
} ]
Loading CSV data
As we mentioned earlier in this tutorial, no pre-processing of CSV data is necessary. The first row in CloudQuote CSV feed are column names, which Data Loader will use automatically if you set useColumnNames to true.
Simple serial chart with historical data
Now that we have introductory pleasantries out of our way, we can jump in creating a real chart.
Let’s start with CloudQuote’s historical price feed: /fcon/getStockPriceHistory.
This feed provides daily data for specific trading symbol.
The URL syntax is as follows:
https://api.cloudquote.net/fcon/getStockPriceHistory.[format]?symbol=[symbol]&from=[from-date]
[format] - csv or json
[symbol] - a company trading symbol, i.e. GOOG, MSFT, etc.
[from-date] - a date in YYYY-MM-DD format to load data from
For simplicity’s sake, we’re going to go with CSV:
"dataLoader": {
  "url": "https://api.cloudquote.net/fcon/getStockPriceHistory.csv?symbol=MSFT&from=2016-01-01",
  "format": "csv",
  "async": true,
  "delimiter": ",",
  "useColumnNames": true,
  "numberFields": [ "Date" ]
}
The Data Loader will load the data for us and put it into array of objects.
The data object loaded from ClourQuote’s historical price feed will look like this:
{
  "Date": 1451941200000,
  "Open": "54.32",
  "High": "54.799999",
  "Low": "53.389999",
  "Close": "54.799999",
  "Volume": "53772490",
  "Adjusted Close": "54.799999"
}
We’re going to use "Date" field for category:
"categoryField": "Date"
Note: CloudQuote provides all dates as JavaScript timestamps, which is a number of milliseconds since 1 January 1970 00:00:00 UTC. This format can be used by amCharts out -of-the-box without any further configuration.
However, it needs to be a number. Since CSV format does not carry information about type of specific fields, we need to use numberFields parameter in Data Loader settings to specify that this specific field is a number and therefore does need to be treated as such and not as string.
We’re also going to use the "Adjusted Close" as a valueField for our graph:
"graphs": [{
  // …
  "valueField": "AdjustedClose"
}]
Here’s all of the above in a working demo: (click "Open in CodePen" for full source code)
See the Pen Article: Hooking up chart to data feed services (demo 1, csv) by amCharts (@amcharts) on CodePen.
And here’s the same chart using JSON format: (with pre-processor as discussed earlier in this tutorial)
See the Pen Article: Hooking up chart to data feed services (demo 1, json) by amCharts (@amcharts) on CodePen.
Note that JSON format does not require format parameter since JSON is assumed by default, as well as as numberFields because JSON carries variable type information, so date timestamps already come in as numbers.
A more complex historical Stock Chart
We used a very basic one-symbol feed on a basic serial chart to show a price dynamics with a line graph.
Now, let’s try something more interesting.
Let’s build a Stock Chart which shows open/low/high/close graphs as well as sales volume on two separate panels and also compare the prices with a second symbol.
A Stock Chart does not use one dataProvider, but rather multiple "data sets" with their own individual dataProvicer properties. This means that we will need to replace each dataProvider with a dataLoader:
"dataSets": [ {
  "title": "Microsoft (MSFT)",
  // ...
  "dataLoader": {
    "url": "https://api.cloudquote.net/fcon/getStockPriceHistory.csv?symbol=MSFT&from=2010-01-01",
    "format": "csv",
    "delimiter": ",",
    "useColumnNames": true,
    "numberFields": [ "Date" ]
  },
}, {
  "title": "Apple (AAPL)",
  // ...
  "dataLoader": {
    "url": "https://api.cloudquote.net/fcon/getStockPriceHistory.csv?symbol=AAPL&from=2010-01-01",
    "format": "csv",
    "delimiter": ",",
    "useColumnNames": true,
    "numberFields": [ "Date" ]
  },
} ],
As you can see, it’s exactly the same as for serial chart, except we now have a multiple instances of dataLoader.
As usual here’s the working demo:
See the Pen Article: Hooking up chart to data feed services (sample 2, stock, csv) by amCharts (@amcharts) on CodePen.
Real-time intra-day price ticker
Suppose we want to show a simple timeline of the specific symbol. It should be a real-time, meaning the chart needs to update itself with new data constantly.
The API endpoint for this kind of usage is /fcon/getStockTickHistory.
The Data Loader config is very similar like we had before:
"dataLoader": {
  "url": "https://api.cloudquote.net/fcon/getStockTickHistory.json?symbol=MSFT",
  "format": "json",
  "postProcess": function( data, config, chart ) {
    var newData = [];
    for ( var i = 0; i < data.rows.length; i++ ) {
      var dataPoint = {};
      for ( var c = 0; c < data.columns.length; c++ ) {
        dataPoint[ data.columns[ c ] ] = data.rows[ i ][ c ];
      }
      newData.push( dataPoint );
    }
    return newData;
  },
  "reload": 10
}
As you can see we are using the same JSON pre-processing function we used before, albeit different API end-point.
There’s also a new Data Loader parameter: reload. It basically does what it says it does - reload the data every X seconds. (every 10 seconds in this case)
The end-point does not use the from parameter, as it is meant for loading of "live" data for the current day, or if the trading did not yet start for this day, full history from the last trading day.
Taking the above into account, we might want to enhance our pre-processing function to handle both situations. We’re going to detect if the data is from a previous trading day and display an appropriate label on the chart if it is.
Let’s define it as a re-usable function, so we can use it on more than one chart:
AmCharts.parseFinancialContentJSON = function( data, config, chart ) {

  // Init new data
  var newData = [];

  // Reset labels array
  if ( chart.allLabels.length === 1 ) {
    var label = new AmCharts.Label();
    label.text = "";
    chart.allLabels.push( label );
  } else {
    chart.labels[ 1 ].text = "";
  }

  // Empty data set?
  if ( data.rows.length === 0 ) {
    var label = chart.allLabels[ 1 ];
    label.text = "No data for today, yet.";
    label.align = "center";
    label.y = "50%";
    label.size = 18;
    data = [];
    return data;
  }

  // Apply column names
  for ( var i = 0; i < data.rows.length; i++ ) {
    var dataPoint = {};
    for ( var x = 0; x < data.columns.length; x++ ) {
      dataPoint[ data.columns[ x ] ] = data.rows[ i ][ x ];
    }
    newData.push( dataPoint );
  }

  // Data from yesterday?
  if ( new Date( newData[ 0 ].Date ).getUTCDate() != new Date().getUTCDate() ) {
    var label = chart.allLabels[ 1 ];
    label.text = "Showing data from previous trading day.";
    label.align = "center";
    label.y = 5;
    label.size = 10;
  }

  return newData;

}
Then we just need to provide a reference to the function in Data Loader's config:
"dataLoader": {
  "url": "https://api.cloudquote.net/fcon/getStockTickHistory.json?symbol=MSFT",
  "format": "json",
  "postProcess": AmCharts.parseFinancialContentJSON,
  "reload": 10
}
And here’s a live chart using the above:
See the Pen Article: Hooking up chart to data feed services (demo 3, real-time, json) by amCharts (@amcharts) on CodePen.