Intro
Google exposes data from its Analytics service using a number of various APIs.
- CORE REPORTING API (Create custom reports by querying for dimensions and metrics)
- MULTI-CHANNEL FUNNELS REPORTING API (Access attribution and conversion path data for your users)
- REAL TIME REPORTING API (Access activity occurring on your property right now)
- EMBED API (Embed dashboards on a 3rd-party site in minutes)
- METADATA API (Access the list of API dimensions and metrics and attributes)
- We’re going to to look into the most basic - CORE REPORTING API - which is used to extract analytics data for your website usage.
NOTE: you can download the files created in this tutorial using link at the bottom.
Setting up Google Analytics API
Before you can extract data from your Analytics account, you will need to set up an application and API access to it.
Since our main aim is to display Analytics data to users who don’t necessarily have access to our GA accounts, we’ll need the server-to-server authentication and a server-side script to act as a proxy between the user and Google API.
To use that you’ll need to set up a “Service account” in your Google Console.
Follow this excellent tutorial to do so:
Hello Analytics API: PHP quickstart for service accounts
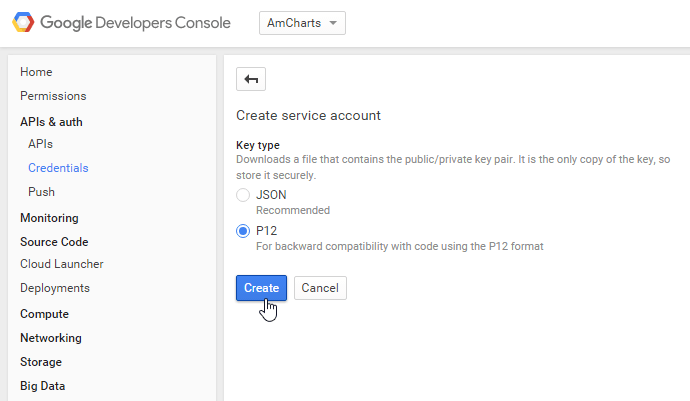
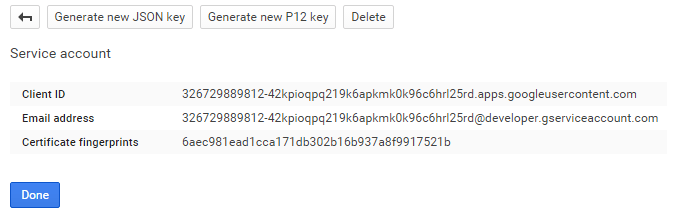
Once you create the Service account, you’ll be offered to save a P12 file. Do it. You’ll need it to authenticate your PHP script’s access to Analytics.
Also note the Email address auto-generated for your application. You’ll need it to set up authentication as well.
Using PHP to extract Google Analytics data
Prerequisites
Google has provided a PHP library to access their API services. Download or better yet check it out directly from their GitHub repository:
https://github.com/google/google-api-php-client
We’ll also be using slightly modified version of the sample PHP script shown in this Google tutorial:
Hello Analytics API: PHP quickstart for service accounts
Authorizing
As mentioned earlier, you’ll need three things to authorize your PHP script for access to your Analytics data:
- Service account email
- Authorization file
- Analytics profile ID
We took the code from Google tutorial and modified it to be slightly more universal:
<?php
/**
 * Load Google API library
 */
require_once 'google-api-php-client/src/Google/autoload.php';

/**
 * Start session to store auth data
 */
session_start();

/**
 * Set Google service account details
 */
$google_account = array(
  'email'   => '********@developer.gserviceaccount.com',
  'key'     => file_get_contents( '********.p12' ),
  'profile' => '85639843'
);

/**
 * Get Analytics API object
 */
function getService( $service_account_email, $key ) {
  // Creates and returns the Analytics service object.

  // Load the Google API PHP Client Library.
  require_once 'google-api-php-client/src/Google/autoload.php';

  // Create and configure a new client object.
  $client = new Google_Client();
  $client->setApplicationName( 'Google Analytics Dashboard' );
  $analytics = new Google_Service_Analytics( $client );

  // Read the generated client_secrets.p12 key.
  $cred = new Google_Auth_AssertionCredentials(
      $service_account_email,
      array( Google_Service_Analytics::ANALYTICS_READONLY ),
      $key
  );
  $client->setAssertionCredentials( $cred );
  if( $client->getAuth()->isAccessTokenExpired() ) {
    $client->getAuth()->refreshTokenWithAssertion( $cred );
  }

  return $analytics;
}

/**
 * Get Analytics API instance
 */
$analytics = getService(
  $google_account[ 'email' ],
  $google_account[ 'key' ]
);

/**
 * Query the Analytics data
 */
$results = $analytics->data_ga->get(
  'ga:' . $google_account[ 'profile' ],
  '30daysAgo',
  'today',
  'ga:sessions',
  array(
    'dimensions'  => 'ga:country',
    'sort'        => '-ga:sessions',
    'max-results' => 20
  ) );
$rows = $results->getRows();
var_dump($rows);
When you run this file, if you have correctly configured your Google API credentials, added Service account email to your Analytics properties, you should see the PHP script print out the number of sessions your web property received in the past 7 days.
array (size=1)
  0 =>
    array (size=1)
      0 => string '7279' (length=4)
Authorization works!
Querying the data
Data from Analytics is extracted using “queries”. In the previous example we used query “ga:sessions” to extract a single number of visitor sessions.
Now let’s do something more interesting. Let’s extract number of sessions from the last 30 days per country.
We’ll replace our query’s start date to “30daysAgo”.
Will leave metric at “ga:sessions”.
We’ll also add additional parameters: dimension (country), sort order, and number of results to return.
$results = $analytics->data_ga->get(
  'ga:' . $profile,
  '30daysAgo',
  'today',
  'ga:sessions',
  array(
    'dimensions'  => 'ga:country',
    'sort'        => '-ga:sessions',
    'max-results' => 10
  ) );
$rows = $results->getRows();
var_dump($rows);
You’ll notice we have introduced the 5th parameter to the get() method call, which is an associative array of optional parameters.
The Google Analytics parameter value usually is prefixed with a “ga:” prefix.
The minus sign in front of “ga:sessions” means I want it to order in ascending order.
Now, when you run the above, you’ll get something like this:
array (size=10)
  0 =>
    array (size=2)
      0 => string 'United States' (length=13)
      1 => string '4858' (length=4)
  1 =>
    array (size=2)
      0 => string 'India' (length=5)
      1 => string '4020' (length=4)
  2 =>
    array (size=2)
      0 => string 'France' (length=6)
      1 => string '1305' (length=4)
  3 =>
    array (size=2)
      0 => string 'Russia' (length=6)
      1 => string '1203' (length=4)
  4 =>
    array (size=2)
      0 => string 'China' (length=5)
      1 => string '1170' (length=4)
...
Neat, huh?
Using Query Explorer to construct and test API queries
Google has provided a powerful tool, that you can use to construct and test API queries, called Query Explorer.
As a side effect of using Query Explorer you can also find out the profile ID of your Analytics property.
Charting extracted data
Now that we have the data, we can go about plotting it with the chart.
Formatting data in JSON
While the data we extracted (session per country) might look OKish on screen, it can’t be used directly by chart. Let’s re-format it to JSON - a format much more suitable for charts.
/**
 * Format and output data as JSON
 */
$data = array();
foreach( $rows as $row ) {
  $data[] = array(
    'country'   => $row[0],
    'sessions'  => $row[1]
  );
}

echo json_encode( $data );
Now that produces a perfect and valid, object-oriented JSON:
[ {
  "country": "United States",
  "sessions": "4867"
}, {
  "country": "India",
  "sessions": "4029"
}, {
  "country": "France",
  "sessions": "1311"
}, {
  "country": "Russia",
  "sessions": "1203"
}, {
  "country": "China",
  "sessions": "1171"
}, {
  "country": "Germany",
  "sessions": "1151"
}, {
  "country": "South Korea",
  "sessions": "1096"
}, {
  "country": "United Kingdom",
  "sessions": "1087"
}, {
  "country": "Japan",
  "sessions": "1064"
}, {
  "country": "Brazil",
  "sessions": "931"
} ]
We’re done with the data.php file for now.
Using the data in chart
We’re going to use amChart’s plugin Data Loader, to automatically load external data:
<!DOCTYPE HTML>
<html>
  <head>
    <meta http-equiv="Content-Type" content="text/html; charset=utf-8">
    <meta name="viewport" content="width=device-width, initial-scale=1, maximum-scale=1">
    <title>amCharts - Google Analytics example</title>
    <script src="https://www.amcharts.com/lib/3/amcharts.js"></script>
    <script src="https://www.amcharts.com/lib/3/serial.js"></script>
    <script src="https://www.amcharts.com/lib/3/plugins/dataloader/dataloader.min.js"></script>
    <style>
    body, html {
      font-family: Verdana;
      font-size: 12px;
    }
    #chartdiv {
      width: 100%;
      height: 400px;
    }
    </style>
    <script>
    var chart = AmCharts.makeChart("chartdiv", {
     "type": "serial",
     "dataLoader": {
        "url": "data.php",
        "format": "json"
     },
     "categoryField": "country",
     "categoryAxis": {
       "gridAlpha": 0.07,
       "title": "Country"
     },
     "valueAxes": [{
       "stackType": "regular",
       "gridAlpha": 0.07,
       "title": "Sessions"
     }],
     "graphs": [{
       "type": "column",
       "title": "Sessions",
       "valueField": "sessions",
       "lineAlpha": 0,
       "fillAlphas": 0.6
     }],
    });
    </script>
  </head>

  <body>
    <div id="chartdiv"></div>
  </body>

</html>
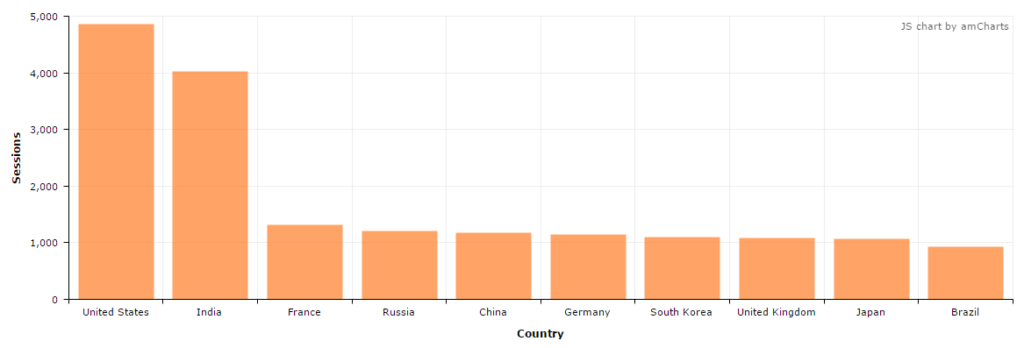
This produces a nice result:
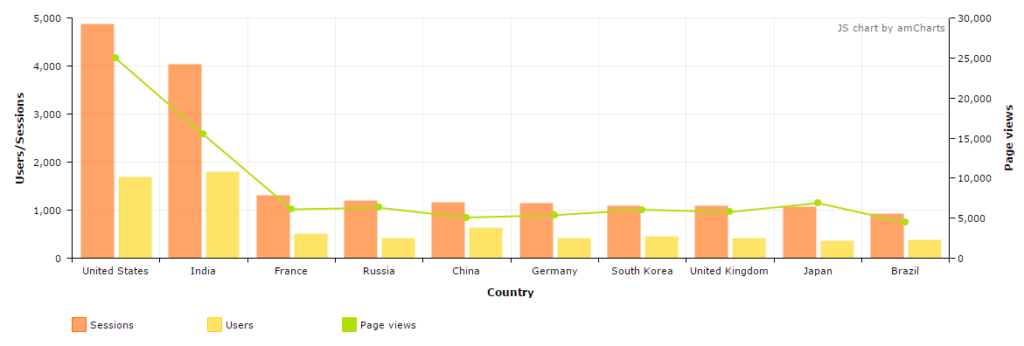
Combining multiple metrics in a single query
Let’s say you want to display a number of metrics in the same dashboard. For example, along sessions you could want to plot number of unique users and page views as well. Naturally, it would be very inefficient to create separate queries for each of those metrics.
Luckily, Analytics API allows to specify several metrics in the same request. You just need to separate them by comma:
/**
 * Query the Analytics data
 */
$results = $analytics->data_ga->get(
  'ga:' . $google_account[ 'profile' ],
  '30daysAgo',
  'today',
  'ga:sessions,ga:users,ga:pageviews',
  array(
    'dimensions'  => 'ga:country',
    'sort'        => '-ga:sessions',
    'max-results' => 10
  ) );
$rows = $results->getRows();

/**
 * Format and output data as JSON
 */
$data = array();
foreach( $rows as $row ) {
  $data[] = array(
    'country'   => $row[0],
    'sessions'  => $row[1],
    'users'     => $row[2],
    'pageviews' => $row[3]
  );
}

echo json_encode( $data );
Now let’s update our chart code to display all that new data:
var chart = AmCharts.makeChart( "chartdiv", {
  "type": "serial",
  "dataLoader": {
    "url": "data.php",
    "format": "json"
  },
  "creditsPosition": "top-right",
  "categoryField": "country",
  "categoryAxis": {
    "gridAlpha": 0.07,
    "gridPosition": "start",
    "tickPosition": "start",
    "title": "Country"
  },
  "valueAxes": [ {
    "id": "v1",
    "gridAlpha": 0.07,
    "title": "Users/Sessions"
  }, {
    "id": "v2",
    "gridAlpha": 0,
    "position": "right",
    "title": "Page views"
  } ],
  "graphs": [ {
    "type": "column",
    "title": "Sessions",
    "valueField": "sessions",
    "lineAlpha": 0,
    "fillAlphas": 0.6
  }, {
    "type": "column",
    "title": "Users",
    "valueField": "users",
    "lineAlpha": 0,
    "fillAlphas": 0.6
  }, {
    "type": "line",
    "valueAxis": "v2",
    "title": "Page views",
    "valueField": "pageviews",
    "lineThickness": 2,
    "bullet": "round"
  } ],
  "legend": {}
} );
And voila:
Files used in this article
Download the final files of the files produced in this article:
amcharts_google_analytics_files.zip