Vue.js is a popular JavaScript framework, and we get regular questions from people wanting to use amCharts in their Vue apps. In this quick guide, we will cover the basics of using amCharts in a most straightforward Vue.js app and then continue with a more advanced setup utilizing Vue components and Webpack.
Hello, Vue + amCharts World
Let’s start with a very basic Vue.js page that renders an amCharts Pie chart on it.
Create a basic HTML boilerplate page. Something like this:
<!DOCTYPE html>
<html lang="en">
<head>
    <meta charset="UTF-8">
    <meta name="viewport" content="width=device-width, initial-scale=1.0">
    <meta http-equiv="X-UA-Compatible" content="ie=edge">
    <title>Document</title>
</head>
<body>

</body>
</html>
Now, let’s add references to the Vue and amCharts libraries:
<script src="https://unpkg.com/vue"></script>
<script src="//www.amcharts.com/lib/3/amcharts.js"></script>
<script src="//www.amcharts.com/lib/3/pie.js"></script>
In the body we will add a div to hold our Vue content and our pie chart:
<div id="app">
    {{ message }}

    <div id="chartdiv" style="width: 100%; height: 400px;"></div>
</div>
Then we should instantiate our Vue app:
<script>
    <em>var</em> app = new <u>Vue</u>({
        el: '#app',
        data: {
            message: 'Hello, Vue + amCharts!'
        }
    })
</script>
And then create our pie chart:
AmCharts.makeChart("chartdiv",
    {
        "type": "pie",
        "titleField": "title",
        "valueField": "value",
        "dataProvider": [
            { "title": "Big slice", "value": 555 },
            { "title": "Small slice", "value": 25 }
        ]
    }
);
And that’s all there is to it.
Except no one probably makes their apps this way. So, let’s continue to a more realistic setup.
Vue + Webpack + amCharts
In this example, we will a add a column chart to a Vue.js app based on webpack-simple template.
You will need Node.js and npm to follow along. Installing these is beyond the scope of this tutorial, so I’ll assume you already have them set up.
You will need to install vue-cli to scaffold our demo project:
$ npm install -g vue-cli
Now we will create our initial project we will work in by running the following commands in our working directory:
$ vue init webpack-simple vue-amcharts
$ cd vue-amcharts
$ npm install
After this, you should have a functional Vue.js app. Test it by running the following command in the vue-amcharts directory:
$ npm run dev
Let’s continue by adding amCharts. Install amCharts JavaScript Charts from npm:
$ npm install amcharts/amcharts3 --save
Import the main amCharts and Serial chart libraries in src/main.js:
import AmCharts from 'amcharts3'
import AmSerial from 'amcharts3/amcharts/serial'
Open App.vue file in the src folder. This is the main component of our app. For the purpose of this tutorial let’s leave the content that is in there intact and just insert a div to hold our chart under the Vue logo. So that the top part of <template> looks something like this:
<template>
  <div id="app">
    <img src="./assets/logo.png">
    <h1>{{ msg }}</h1>

    <div id="chartdiv" style="width: 100%; height: 400px;"></div>

    <h2>Essential Links</h2>
Now let’s add our chart rendering code. In the script section of the component add a created method that will be fired after the Vue component is created and put your amCharts code in it. After you are done your script part of the component should look something like this:
<script>
export default {
  name: 'app',
  data() {
    return {
      msg: 'Welcome to Your Vue.js + amCharts App'
    }
  },
  created () {
    AmCharts.makeChart("chartdiv",
      {
        "type": "serial",
        "categoryField": "type",
        "chartCursor": {},
        "graphs": [
          {
            "type": "column",
            "title": "Pizza types",
            "valueField": "sold",
            "fillAlphas": 0.8
          }
        ],

        "dataProvider": [
          { "type": "Margherita", "sold": 120 },
          { "type": "Funghi", "sold": 82 },
          { "type": "Capricciosa", "sold": 78 },
          { "type": "Quattro Stagioni", "sold": 71 }
        ]
      }
    );
  }
}
</script>
Run npm run dev and what you see should look like this:
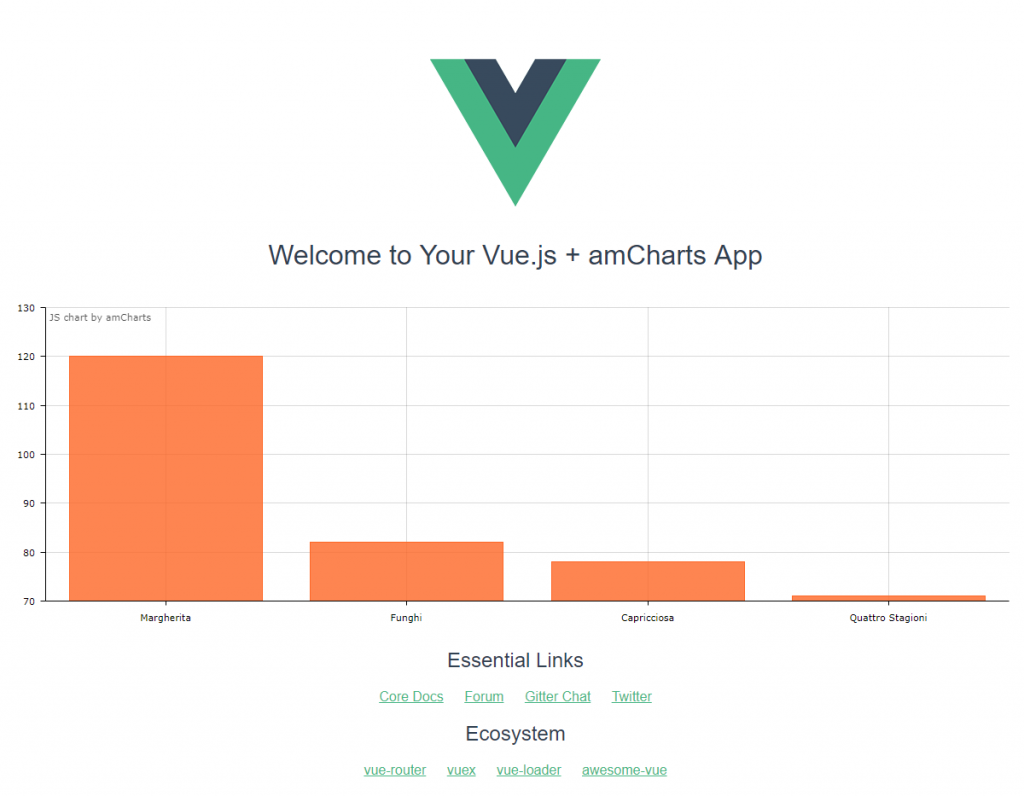
That would be all for the simplest case. However, there’s a little bit more to it.
If you zoom into this chart by selecting a portion of it with your mouse, you would see something missing:
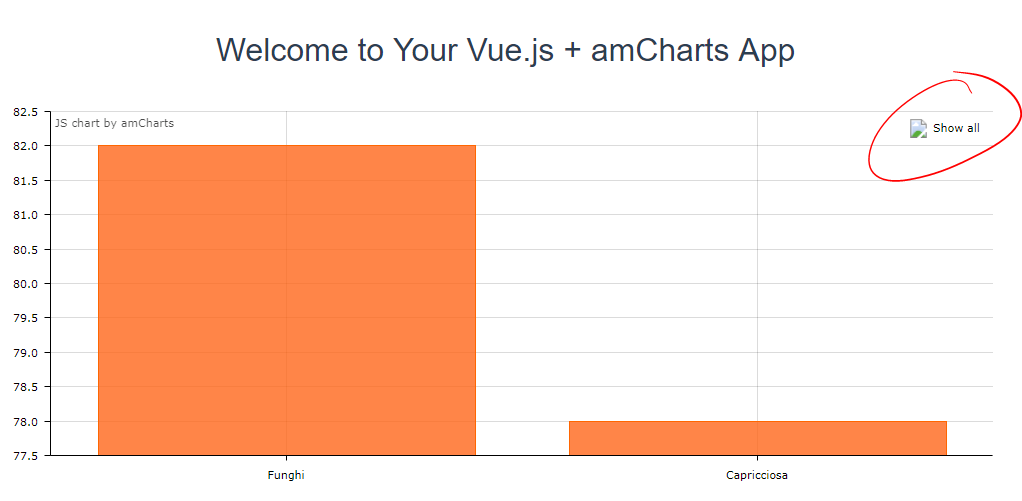
That’s because the chart is looking for image assets for some of its elements (“lens” button image in this case) and not finding them. To resolve this, we need to update our Webpack configuration to bring these needed assets over. We will instruct Webpack to simply copy the assets to our output directory (“dist” by default).
To do that we will utilize Copy Webpack Plugin. Install it by issuing this command:
$ npm install --save-dev copy-webpack-plugin
Open webpack.config.js file and add a statement to include the plugin at the top:
var CopyWebpackPlugin = require('copy-webpack-plugin');
Then add plugins section to the Webpack configuration:
plugins: [
  new <u>CopyWebpackPlugin</u>([{ from: 'node_modules/amcharts3/amcharts/images', to: 'amcharts/images' },])
],
This will copy the images over. You may want to copy other assets as well if you plan to use amCharts plugins, but just images should be enough in the scope of this tutorial.
The final step left is to inform amCharts of the root directory for amCharts assets. Go back to the App.vue component file and add “path” setting to the call to makeChart:
AmCharts.makeChart("chartdiv",
  {
    "path": "dist/amcharts/",
    "type": "serial",
    "categoryField": "type",
Run the build process once to copy the files over:
$ npm run build
And now you should be ready to go.
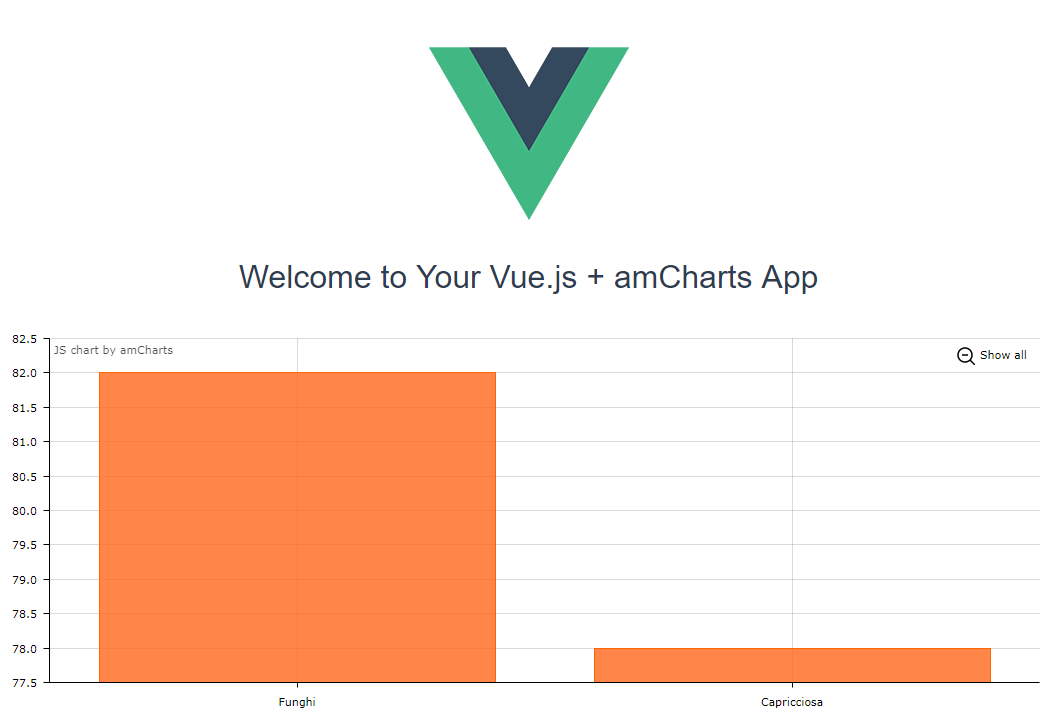
Start your dev environment again with npm run dev and everything should be in place now:
You can download all the code for the above samples here.