Chart which parses dates vs the one which doesn’t
I might be wrong, but I make a guess that at least 50% of all serial charts have date/time on they category axis – they show how some value changed over a time. That’s why, when choosing a charting library, one of the main thing you should check is whether it parses dates and treats them in intelligent way. You might ask – why would I need that, a simple serial chart will display dates as strings on the axis and that’s enough. It might be enough if you show 10 or 20 data points, but not if you have plenty. Let’s say you have daily data for one year – 365 data points. The chart which would treat dates as strings would simply do the following – checks how many data points are in the data, and as category axis can’t place 365 labels in one view, pick every x data point and show labels on the axis. This will produce the following result:
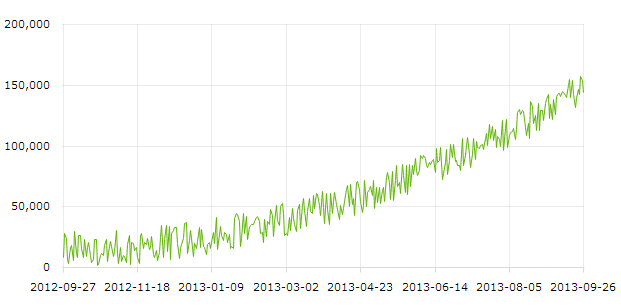
As you see, the grid is placed at dates which doesn’t tell the viewer anything. This is a place where parsing and treating dates in intelligent way is required.
Our charting library has a lot of possibilities to make date/time charts look good and give the viewer a much better picture. All you need to do is to tell CategoryAxis that it should parse dates and minimum duration of your data:
var categoryAxis = chart.categoryAxis;
categoryAxis.parseDates = true;
categoryAxis.minPeriod = "DD";
In case you have hourly data, minPeriod will be "hh", if your data is monthly - "MM", etc. Finally, tell the chart date format of your data:
chart.dataDateFormat = "YYYY-MM-DD";
Side note: you can use any date format you want, check this page for more options.
The above chart with dates parsed:
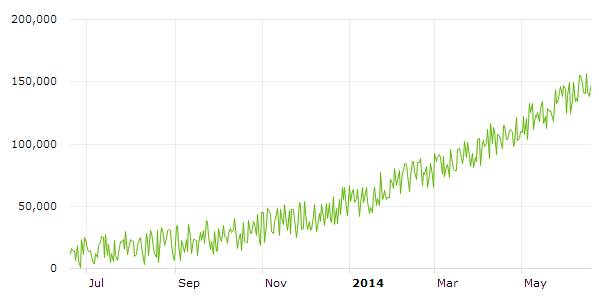
As you see, the chart placed grid lines on the beginning of each month. And even more – on the beginning of the 2014, it used a different date format and showed the year, in bold. I guess no need to explain that this chart is way better than the first one.
To see this in action, open our date-based chart example and try to zoom-in the chart using scrollbar. You will notice that the grid lines are placed at logical intervals – days, weeks, months, three months and similar. The date format changes, depending on the selected period.
Formatting dates in a different way
You might want to use a different date formatting, for example, I want year number to be next to each month label and I don’t want a different format for the beginning of the year. CategoryAxis has a dateFormats property, with the following default value:
[{
    period: 'fff',
    format: 'JJ:NN:SS'
}, {
    period: 'ss',
    format: 'JJ:NN:SS'
}, {
    period: 'mm',
    format: 'JJ:NN'
}, {
    period: 'hh',
    format: 'JJ:NN'
}, {
    period: 'DD',
    format: 'MMM DD'
}, {
    period: 'WW',
    format: 'MMM DD'
}, {
    period: 'MM',
    format: 'MMM'
}, {
    period: 'YYYY',
    format: 'YYYY'
}]
So in this case we need to modify the "MM" (month) and "YYYY" (year) format to the same value:
categoryAxis.dateFormats = [{
    period: 'fff',
    format: 'JJ:NN:SS'
}, {
    period: 'ss',
    format: 'JJ:NN:SS'
}, {
    period: 'mm',
    format: 'JJ:NN'
}, {
    period: 'hh',
    format: 'JJ:NN'
}, {
    period: 'DD',
    format: 'MMM DD'
}, {
    period: 'WW',
    format: 'MMM DD'
}, {
    period: 'MM',
    format: 'MMM YYYY'
}, {
    period: 'YYYY',
    format: 'MMM YYYY'
}];
Notice, I changed "MM" and "YYYY" format to "MMM YYYY". And the result is:
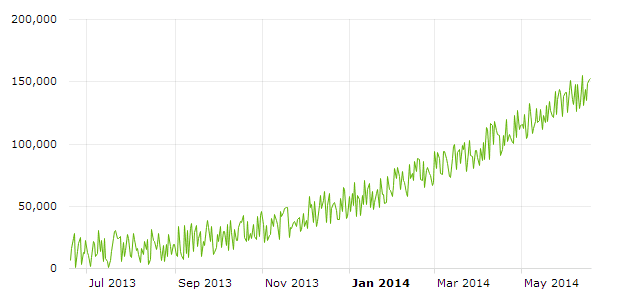
You see – it’s so simple with amCharts. Just in case you don’t want bold year, set:
categoryAxis.boldPeriodBeginning = false;
Treating gaps in data
In case the library you use doesn’t support time/date series, all the data points will be placed next to each other. Imagine, you have to visualize data which has values only on weekdays and no data on weekends, and your boss requires to show these weekends in your data. What would you do? You can, of course, add empty data points for the weekends, but what if the gaps are bigger and random one?
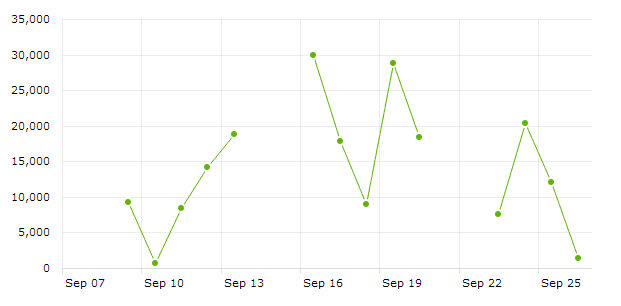
Our library, amCharts can offer you different ways of treating gaps in data. Here is the chart with no data on weekends:
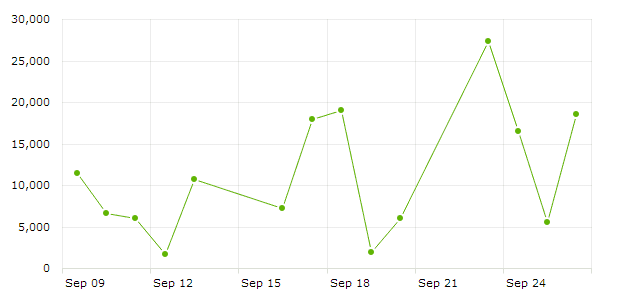
Notice – the distance between some points is bigger. That’s because we still show the dates on the axis, but as there is no data for these dates, the gaps are bigger.
In case you want to show these gaps on your graph, you should add the dates with no data points in your data provider and then set connect property of AmGraph to false: graph.connect = false; And the result is:
What if you want all data points to be placed at equal intervals, and remove weekends from the axis? All you need to do is set:
categoryAxis.equalSpacing = true;
And the weekends will be gone!