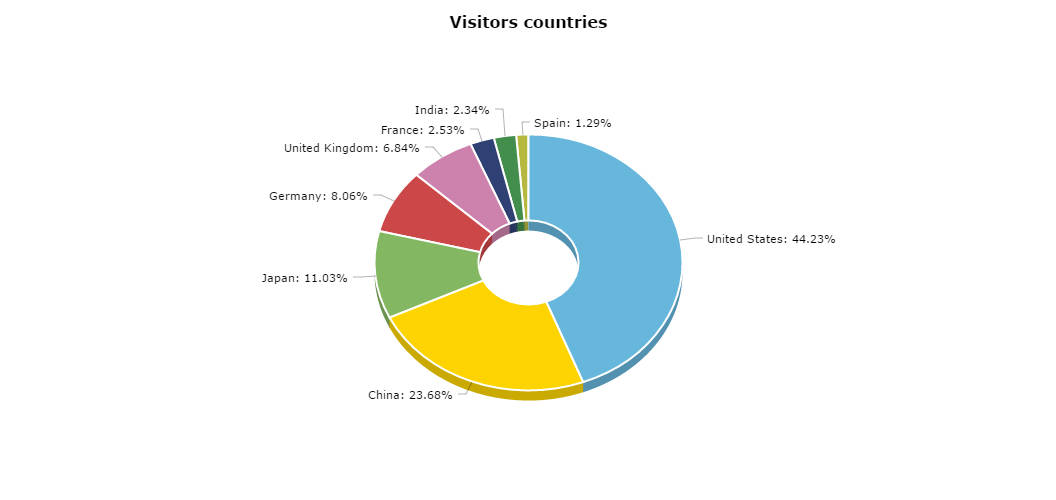
JavaScript Charts: 3D donut chart
<script type="text/javascript">
var chart;
var chartData = [{
country: "United States",
visits: 9252
}, {
country: "China",
visits: 1882
}, {
country: "Japan",
visits: 1809
}, {
country: "Germany",
visits: 1322
}, {
country: "United Kingdom",
visits: 1122
}, {
country: "France",
visits: 1114
}, {
country: "India",
visits: 984
}, {
country: "Spain",
visits: 711
}];
AmCharts.ready(function () {
// PIE CHART
chart = new AmCharts.AmPieChart();
// title of the chart
chart.addTitle("Visitors countries", 16);
chart.dataProvider = chartData;
chart.titleField = "country";
chart.valueField = "visits";
chart.sequencedAnimation = true;
chart.startEffect = "elastic";
chart.innerRadius = "30%";
chart.startDuration = 2;
chart.labelRadius = 15;
// the following two lines makes the chart 3D
chart.depth3D = 10;
chart.angle = 15;
// WRITE
chart.write("chartdiv");
});
</script>
<div id="chartdiv" style="width:100%; height:400px;"></div>
 3D donut chart
|