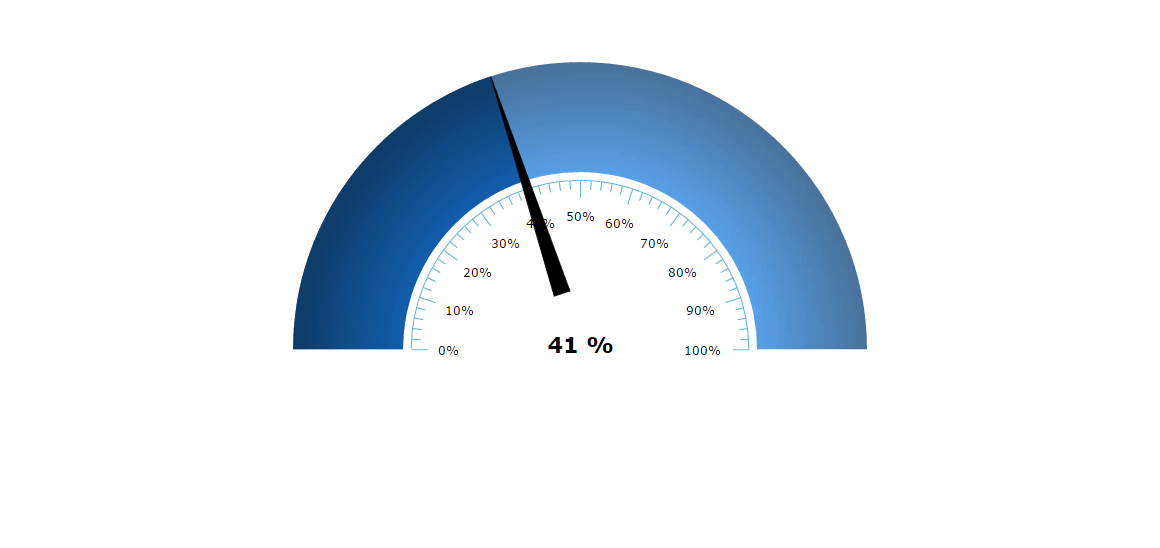
Animated gauge
This demo shows how to implement dynamic, good-looking dashboards.
The gradient fill of the GaugeBand is achieved via gradientRatio setting.
The arrow and band angle is updated via setValue() and setStartValue() / setEndValue() API functions respectively.
Demo source