Bubble Chart
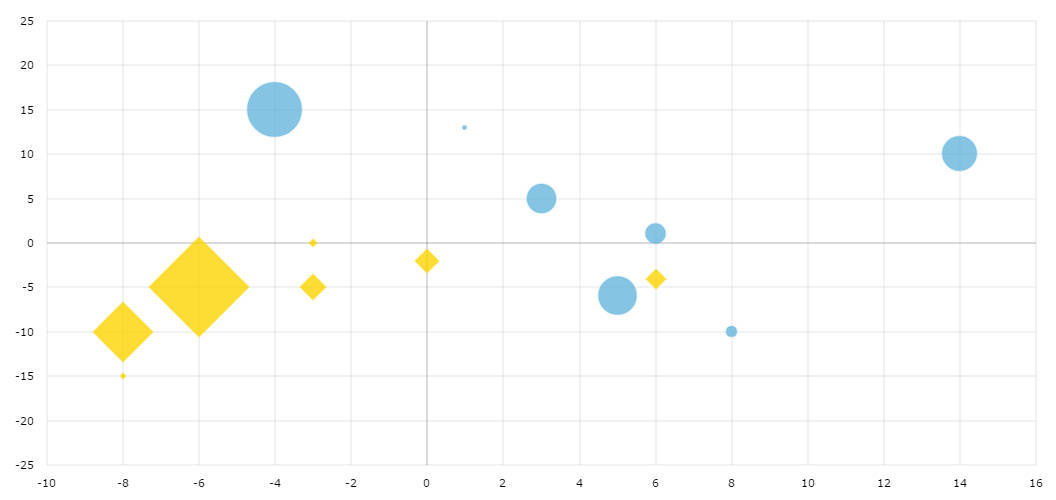
A bubble chart is a type of chart that displays three dimensions of data by position and size of the bullet. The main difference of bubble chart from serial chart is that both x and y axes are numeric – serial chart usually has one axis with strings or dates.
Main features
Our Bubble or XY chart is extremely powerful. Users can zoom and scroll the chart, it does support any number of value axes. We offer a number of predefined bullets – circle, rectangle, triangle, bubble, diamond or you can use custom images as bullets. Our bubble chart supports Guides and Trend Lines. With special bullet types xError and yError you can build XY Error chart.
Demo source