Bullet Chart
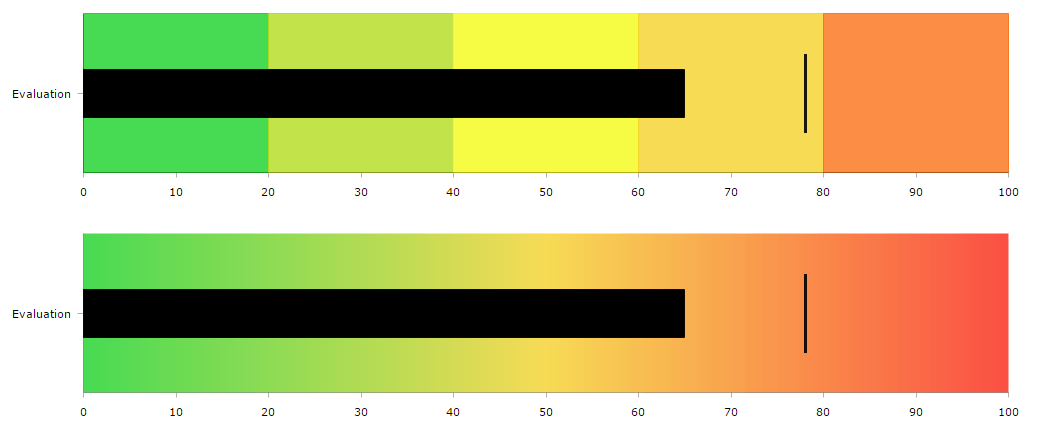
Bullet chart is just a simple serial chart with one category value only. As it is made of serial chart, it can be both horizontal and vertical. The upper chart is made out of 5 column graphs which form the background, another black column graph which shows the value reached and a step line graph showing the dash, which sometimes indicates goal or a maximum value reached. The lower graph, instead of 5 column graphs uses one column graph filled with gradient.
Demo source