Logarithmic Scale
For data, which grows exponentially you might need logarithmic scale axis. This is quite often used in financial charts, to show the grow of stocks over a long period. The use of the logarithms of the values rather than the actual values reduces a wide range to a more manageable size.
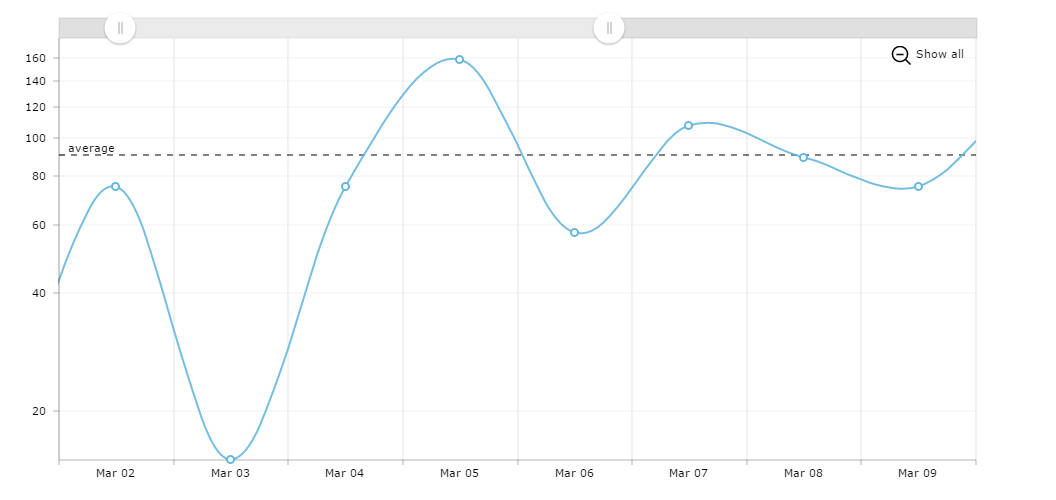
Using guides for horizontal or vertical lines
Both value and category axis can display guides – straight infinite lines, possibly with text annotations next to them. You can use this feature to show average values, mark events, color some value ranges to indicate a possible value fluctuation and more.
Demo source