Stacked Area
Our Serial chart supports stacked or 100% stacked areas. Technically, area graph is just a regular line graph with fill opacity set to some bigger than 0 value. This means you can easily switch from area to line only by modifying this property. And even more – you can simply change this area to smoothed-area or step-area chart by changing a single type property of AmGraph.
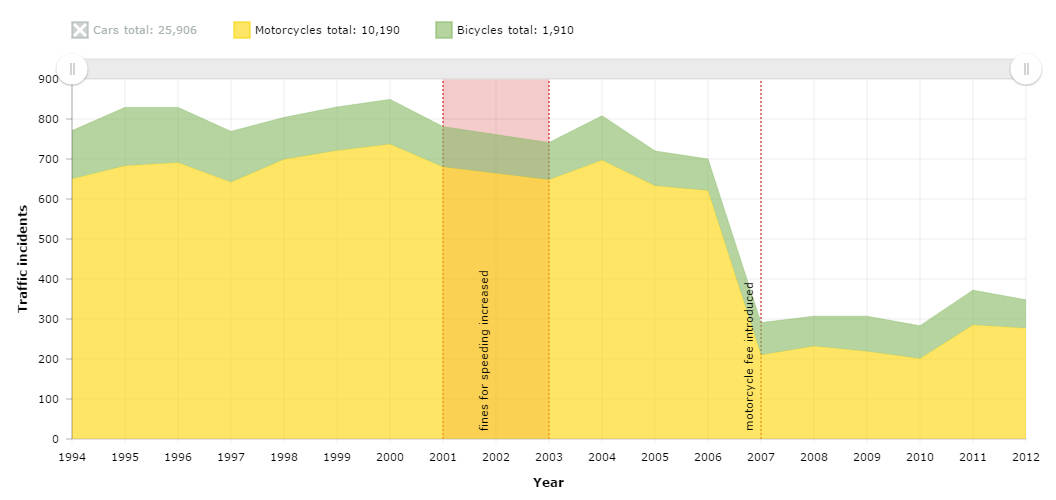
Hidden graphs
Legend of our charts allows showing/hiding graphs by clicking on the legend item you want to hide or show. You can also define which of the graphs are hidden by default – notice, the “cars” graph is hidden at the moment the chart is loaded and you can show it if you click it’s legend marker.
Vertical lines and fills
You can fill the area between two categories with some color, add annotation to it using Guides. The same guides are used to create a single-lines to mark some event. Guides can be added to both category and value axes.
Demo source