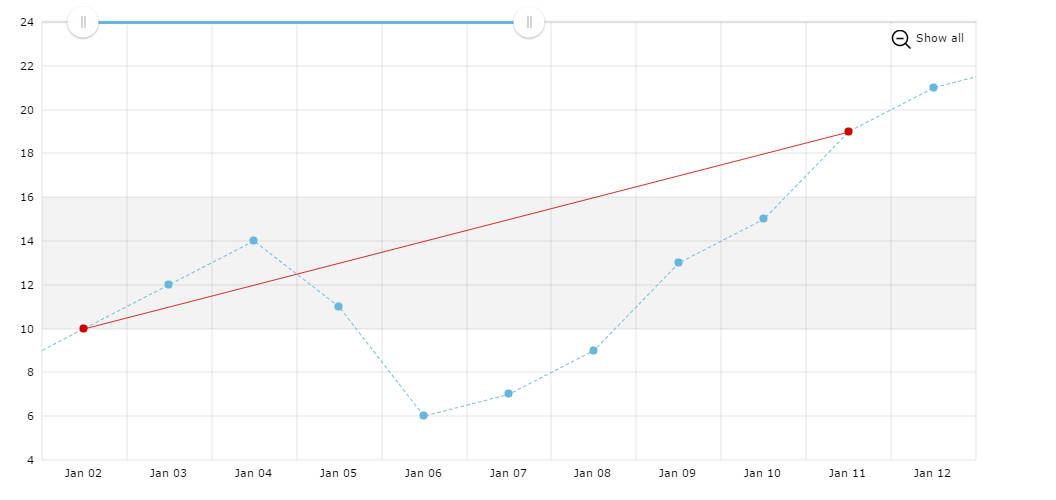
Trend Lines
Trend lines are straight lines from one given category / value axis point to another. Trend lines are used to indicate the general changes over time, also as technical indicators in financial charts. In case you need a possibility to allow your users draw the trend lines, check this Stock Chart example.
Infinite fills or lines
For infinite lines or fills, crossing all plot area without start/end horizontally or vertically (notice the horizontal fill from 10 to 16), you can use Guides.
Demo source