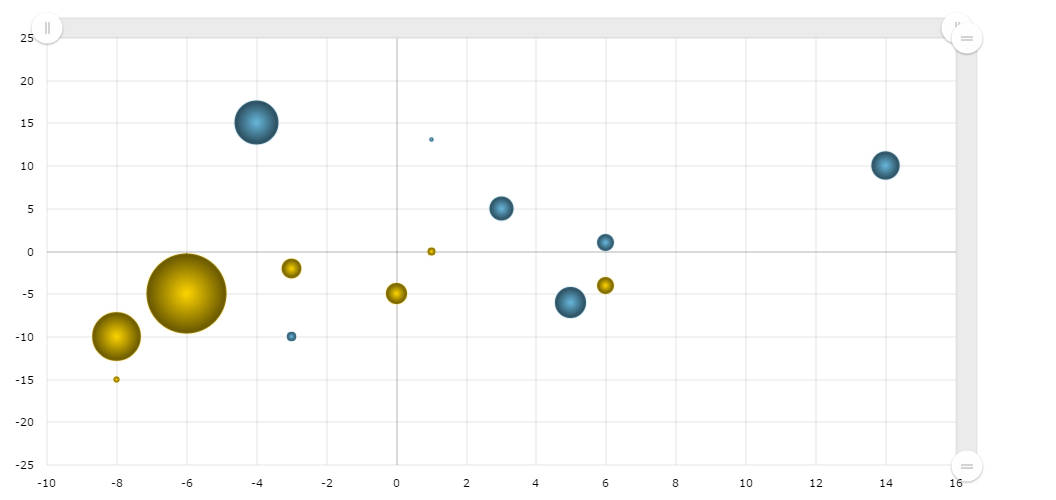
Zoomable Bubble Chart
Our Bubble/XY chart can be zoomed-in and scrolled. Have you seen this anywhere else? Try to select some area of the chart – it will be zoomed-in. And even more – you can disable zooming and use the cursor just to mark some area on the chart. If you need to find values of the selection, check this tutorial: Detecting at what value mouse pointer is. By the way – it is even possible to bound the size of the bullets to value axis – they will change size when zooming in this case.
Demo source