Map with Curved Lines
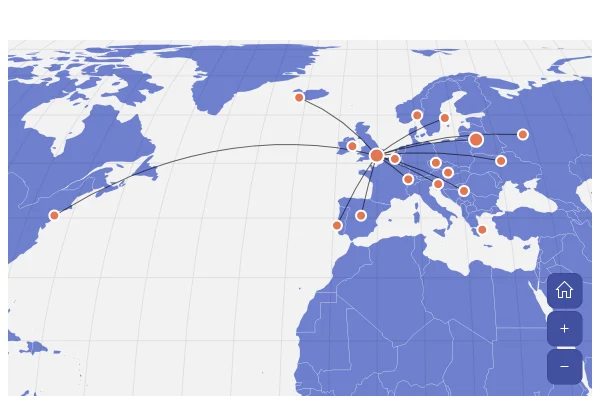
Lines from London to ten cities in Europe and North America, with an arrow pointing to each destination. They take the shortest way over the globe, which bends them on a flat map.
About this map
Why the lines curve
Map lines follow great circles by default, the shortest route between two points on a sphere. On a flat Mercator map these routes bow toward the pole, which is why the line to New York arcs north over the Atlantic; on the globe they run straight. Set lineType to "straight" for lines that are straight on the flat map instead.
Good for
- Flight routes and connections from a hub
- True distances and directions
- Networks of offices, partners or customers
Think twice when
- Hundreds of lines: they tangle, so bundle them or show counts
- Volumes on each route: a map Sankey sizes the bands
- Short local trips: straight and curved look the same
For developers
Get the code.
Built with amCharts 5, a JavaScript library. The JavaScript includes your theme and renderer (canvas or SVG); the JSON also follows the changes you make with the controls.
For projects that use npm:
How it reads:
npm install @amcharts/amcharts5 and @amcharts/amcharts5-geodata. See Getting started.
The same chart as a JSON config. Chart Maker reads and writes this format, the library's JSON parser turns it into a chart, and the <am5-chart> element puts it on a page with no code.How it reads:
"type" is the class to create and "settings" what you would pass to its new() in code; "properties" fill in its parts, lists such as series and axes or templates such as columns.template; "refs" holds objects used in more than one place ("#series-0" stands for the one named series-0); a string starting with "@" takes a value from another object, such as "@series.get('fill')".
A complete page. Save it as an .html file and open it in a browser.
Paste this into an AI coding assistant to build the chart from scratch. More in amCharts & AI.
// Create root element
// https://docs.amcharts.com/v5/getting-started/#root-element
var root = am5.Root.new("chartdiv");

// Set themes
// https://docs.amcharts.com/v5/concepts/themes/
root.setThemes([
  am5themes_Animated.new(root),
  am5themes_Responsive.new(root)
]);

// Colors from the theme, so the map follows the theme
var colors = am5.ColorSet.new(root, {});

// Create the map chart
// https://docs.amcharts.com/v5/charts/map-chart/
var chart = root.container.children.push(am5map.MapChart.new(root, {
  // near-black space behind the satellite picture, shown only with it
  background: am5.Rectangle.new(root, {
    fill: am5.color(0x101318),
    fillOpacity: 0
  }),
  // go to the home view once the map is fitted
  autoHome: true,
  panX: "translateX", // dragging moves the map sideways...
  panY: "translateY", // ...and up and down
  // start zoomed in on Europe and the North Atlantic
  homeZoomLevel: 3,
  homeGeoPoint: { latitude: 39, longitude: -24.3 }, // centered over the Atlantic, west of Portugal
  minZoomLevel: 0.5,               // can zoom out to half the fitted size
  projection: am5map.geoMercator() // the familiar flat world map
}));

// Add zoom control
// https://docs.amcharts.com/v5/charts/map-chart/map-pan-zoom/#zoom-control
var zoomControl = chart.set("zoomControl", am5map.ZoomControl.new(root, {})); // + and - zoom buttons

// the home button is hidden by default
zoomControl.homeButton.set("visible", true);

// Create series for the water: a faint fill behind the countries
// https://docs.amcharts.com/v5/charts/map-chart/map-polygon-series/#background-polygon
var waterSeries = chart.series.push(am5map.MapPolygonSeries.new(root, {
  // the map fits the countries, not this rectangle around the whole world
  affectsBounds: false
}));

waterSeries.mapPolygons.template.setAll({
  fill: root.interfaceColors.get("alternativeBackground"), // the color that contrasts with the background...
  fillOpacity: 0.05, // ...barely there
  strokeOpacity: 0   // no outline
});

waterSeries.data.push({
  geometry: am5map.getGeoRectangle(90, 180, -90, -180) // a rectangle over the whole globe
});

// Satellite view: NASA's picture of the Earth by day, under the grid lines and the countries. Hidden at first
// (visible: false): make it visible for the satellite view
// https://docs.amcharts.com/v5/charts/map-chart/map-raster-series/
var satelliteSeries = chart.series.push(am5map.MapRasterSeries.new(root, {
  visible: false,
  // the map fits the countries, not the whole picture
  affectsBounds: false
}));

// Create main polygon series for countries
// https://docs.amcharts.com/v5/charts/map-chart/map-polygon-series/
var polygonSeries = chart.series.push(am5map.MapPolygonSeries.new(root, {
  name: "Polygon Series",
  geoJSON: am5geodata_worldLow // the world's countries, in low detail
}));

// grid lines every 10 degrees
var graticuleSeries = chart.series.push(am5map.GraticuleSeries.new(root, {
  name: "Graticule Series"
}));
graticuleSeries.mapLines.template.setAll({
  stroke: root.interfaceColors.get("alternativeBackground"), // contrasting with the background...
  strokeOpacity: 0.08 // ...and very faint
});

// Create line series for trajectory lines
// https://docs.amcharts.com/v5/charts/map-chart/map-line-series/
// each line takes the shortest way over the globe, which looks curved on a flat map
var lineSeries = chart.series.push(am5map.MapLineSeries.new(root, {
  name: "Line Series"
}));
lineSeries.mapLines.template.setAll({
  stroke: root.interfaceColors.get("alternativeBackground"), // contrasting with the background...
  strokeOpacity: 0.6 // ...slightly faded
});

// destination series
var citySeries = chart.series.push(
  am5map.MapPointSeries.new(root, {
    name: "City Series"
  })
);

citySeries.bullets.push(function() {
  var circle = am5.Circle.new(root, {
    radius: 5,                 // 5px radius
    tooltipText: "{title}",    // the city's name on hover
    tooltipY: 0,               // the tooltip points at the top of the dot
    fill: colors.getIndex(10), // a theme color
    stroke: root.interfaceColors.get("background"), // a ring in the background color...
    strokeWidth: 2 // ...2px wide
  });

  return am5.Bullet.new(root, {
    sprite: circle
  });
});

// arrow series
var arrowSeries = chart.series.push(
  am5map.MapPointSeries.new(root, {
    name: "Arrow Series"
  })
);

// the arrows, kept to color them with the lines
var arrows = [];

arrowSeries.bullets.push(function() {
  var arrow = am5.Graphics.new(root, {
    fill: root.interfaceColors.get("alternativeBackground"),   // filled...
    stroke: root.interfaceColors.get("alternativeBackground"), // ...and outlined in the contrast color
    // a small triangle pointing right; autoRotate in the data turns it along its line
    svgPath: "M0,-3 L8,0 L0,3 Z"
  });
  arrows.push(arrow);

  return am5.Bullet.new(root, {
    sprite: arrow
  });
});

var cities = [
  {
    id: "london",
    title: "London",
    geometry: { type: "Point", coordinates: [-0.1262, 51.5002] },
  },
  {
    id: "brussels",
    title: "Brussels",
    geometry: { type: "Point", coordinates: [4.3676, 50.8371] }
  }, {
    id: "prague",
    title: "Prague",
    geometry: { type: "Point", coordinates: [14.4205, 50.0878] }
  }, {
    id: "athens",
    title: "Athens",
    geometry: { type: "Point", coordinates: [23.7166, 37.9792] }
  }, {
    id: "reykjavik",
    title: "Reykjavik",
    geometry: { type: "Point", coordinates: [-21.8952, 64.1353] }
  }, {
    id: "dublin",
    title: "Dublin",
    geometry: { type: "Point", coordinates: [-6.2675, 53.3441] }
  }, {
    id: "oslo",
    title: "Oslo",
    geometry: { type: "Point", coordinates: [10.7387, 59.9138] }
  }, {
    id: "lisbon",
    title: "Lisbon",
    geometry: { type: "Point", coordinates: [-9.1355, 38.7072] }
  }, {
    id: "moscow",
    title: "Moscow",
    geometry: { type: "Point", coordinates: [37.6176, 55.7558] }
  }, {
    id: "belgrade",
    title: "Belgrade",
    geometry: { type: "Point", coordinates: [20.4781, 44.8048] }
  }, {
    id: "bratislava",
    title: "Bratislava",
    geometry: { type: "Point", coordinates: [17.1547, 48.2116] }
  }, {
    id: "ljubljana",
    title: "Ljubljana",
    geometry: { type: "Point", coordinates: [14.5060, 46.0514] }
  }, {
    id: "madrid",
    title: "Madrid",
    geometry: { type: "Point", coordinates: [-3.7033, 40.4167] }
  }, {
    id: "stockholm",
    title: "Stockholm",
    geometry: { type: "Point", coordinates: [18.0645, 59.3328] }
  }, {
    id: "bern",
    title: "Bern",
    geometry: { type: "Point", coordinates: [7.4481, 46.9480] }
  }, {
    id: "kyiv",
    title: "Kyiv",
    geometry: { type: "Point", coordinates: [30.5367, 50.4422] }
  }, {
    id: "paris",
    title: "Paris",
    geometry: { type: "Point", coordinates: [2.3510, 48.8567] }
  }, {
    id: "new york",
    title: "New York",
    geometry: { type: "Point", coordinates: [-74, 40.43] }
  }];

citySeries.data.setAll(cities);

// prepare line series data
var destinations = ["reykjavik", "lisbon", "moscow", "belgrade", "ljubljana", "madrid", "stockholm", "bern", "kyiv", "new york"];

// lines connect cities by their ids
lineSeries.set("pointSeries", citySeries);

lineSeries.data.setAll(destinations.map(function (did) {
  return { id: did, pointIds: ["london", did] }; // each line runs from London to a destination
}));

// arrows sit in the middle of the line with the same id
arrowSeries.data.setAll(destinations.map(function (did) {
  return { lineId: did, positionOnLine: 0.5, autoRotate: true }; // halfway, turned along the line
}));

// The image credit
var credit = chart.children.push(am5.Label.new(root, {
  text: "Imagery: NASA Earth Observatory",
  fontSize: 12,              // small...
  fill: am5.color(0xffffff), // ...white...
  fillOpacity: 0.6,          // ...slightly faded text
  x: am5.p100,               // at the right edge...
  centerX: am5.p100,         // ...anchored by its right end...
  dx: -10,                   // ...10px in from it
  y: 10,                     // 10px from the top
  visible: false             // shown only with the satellite picture
}));

// The countries' own look, to go back to
var landTemplate = polygonSeries.mapPolygons.template;
var landLook = {
  fillOpacity: landTemplate.get("fillOpacity", 1),
  stroke: landTemplate.get("stroke", root.interfaceColors.get("background")),
  strokeOpacity: landTemplate.get("strokeOpacity", 1)
};

// The picture loads the first time it shows. Then the countries turn to white outlines over it, the grid lines, the
// lines and the arrows turn white, the credit shows and the map sits in near-black space
satelliteSeries.on("visible", function(visible) {
  if (visible) {
    satelliteSeries.set("src", "https://cdn.amcharts.com/lib/5/geodata/images/earthDay2048.jpg");
  }
  credit.set("visible", visible);
  chart.get("background").set("fillOpacity", visible ? 1 : 0);
  landTemplate.setAll(visible ? { fillOpacity: 0, stroke: am5.color(0xffffff), strokeOpacity: 0.6 } : landLook);
  // white over the picture, otherwise the color that contrasts with the background
  var lineColor = visible ? am5.color(0xffffff) : root.interfaceColors.get("alternativeBackground");
  graticuleSeries.mapLines.template.set("stroke", lineColor);
  lineSeries.mapLines.template.set("stroke", lineColor);
  am5.array.each(arrows, function(arrow) {
    arrow.setAll({ fill: lineColor, stroke: lineColor });
  });
});

// Make stuff animate on load
chart.appear(1000, 100);
{
"type": "MapChart",
"settings": {
"background": {
"type": "Rectangle",
"settings": {
"fill": {
"type": "Color",
"value": "#101318"
},
"fillOpacity": 0
}
},
"autoHome": true,
"panX": "translateX",
"panY": "translateY",
"homeZoomLevel": 3,
"homeGeoPoint": {
"latitude": 39,
"longitude": -24.3
},
"minZoomLevel": 0.5,
"zoomControl": {
"type": "ZoomControl",
"properties": {
"homeButton": {
"settings": {
"visible": true
}
}
}
},
"projectionName": "geoMercator"
},
"properties": {
"series": [
"#series-0",
"#series-1",
"#series-2",
"#series-3",
"#series-4",
"#series-5",
"#series-6"
]
},
"children": [
{
"type": "Label",
"settings": {
"text": "Imagery: NASA Earth Observatory",
"fontSize": 12,
"fill": {
"type": "Color",
"value": "#ffffff"
},
"fillOpacity": 0.6,
"x": {
"type": "Percent",
"value": 100
},
"centerX": {
"type": "Percent",
"value": 100
},
"dx": -10,
"y": 10,
"visible": false
},
"index": 2
}
],
"refs": [
{
"data-0": [
{
"geometry": {
"type": "GeoRectangle",
"north": 90,
"east": 180,
"south": -90,
"west": -180
},
"__parse": true
}
]
},
{
"data-1": []
},
{
"data-2": []
},
{
"data-3": [
{
"id": "reykjavik",
"pointIds": [
"london",
"reykjavik"
],
"__parse": true
},
{
"id": "lisbon",
"pointIds": [
"london",
"lisbon"
],
"__parse": true
},
{
"id": "moscow",
"pointIds": [
"london",
"moscow"
],
"__parse": true
},
{
"id": "belgrade",
"pointIds": [
"london",
"belgrade"
],
"__parse": true
},
{
"id": "ljubljana",
"pointIds": [
"london",
"ljubljana"
],
"__parse": true
},
{
"id": "madrid",
"pointIds": [
"london",
"madrid"
],
"__parse": true
},
{
"id": "stockholm",
"pointIds": [
"london",
"stockholm"
],
"__parse": true
},
{
"id": "bern",
"pointIds": [
"london",
"bern"
],
"__parse": true
},
{
"id": "kyiv",
"pointIds": [
"london",
"kyiv"
],
"__parse": true
},
{
"id": "new york",
"pointIds": [
"london",
"new york"
],
"__parse": true
}
]
},
{
"data-4": [
{
"id": "london",
"title": "London",
"geometry": {
"type": "Point",
"coordinates": [-0.1262, 51.5002],
"__parse": true
},
"__parse": true
},
{
"id": "brussels",
"title": "Brussels",
"geometry": {
"type": "Point",
"coordinates": [4.3676, 50.8371],
"__parse": true
},
"__parse": true
},
{
"id": "prague",
"title": "Prague",
"geometry": {
"type": "Point",
"coordinates": [14.4205, 50.0878],
"__parse": true
},
"__parse": true
},
{
"id": "athens",
"title": "Athens",
"geometry": {
"type": "Point",
"coordinates": [23.7166, 37.9792],
"__parse": true
},
"__parse": true
},
{
"id": "reykjavik",
"title": "Reykjavik",
"geometry": {
"type": "Point",
"coordinates": [-21.8952, 64.1353],
"__parse": true
},
"__parse": true
},
{
"id": "dublin",
"title": "Dublin",
"geometry": {
"type": "Point",
"coordinates": [-6.2675, 53.3441],
"__parse": true
},
"__parse": true
},
{
"id": "oslo",
"title": "Oslo",
"geometry": {
"type": "Point",
"coordinates": [10.7387, 59.9138],
"__parse": true
},
"__parse": true
},
{
"id": "lisbon",
"title": "Lisbon",
"geometry": {
"type": "Point",
"coordinates": [-9.1355, 38.7072],
"__parse": true
},
"__parse": true
},
{
"id": "moscow",
"title": "Moscow",
"geometry": {
"type": "Point",
"coordinates": [37.6176, 55.7558],
"__parse": true
},
"__parse": true
},
{
"id": "belgrade",
"title": "Belgrade",
"geometry": {
"type": "Point",
"coordinates": [20.4781, 44.8048],
"__parse": true
},
"__parse": true
},
{
"id": "bratislava",
"title": "Bratislava",
"geometry": {
"type": "Point",
"coordinates": [17.1547, 48.2116],
"__parse": true
},
"__parse": true
},
{
"id": "ljubljana",
"title": "Ljubljana",
"geometry": {
"type": "Point",
"coordinates": [14.506, 46.0514],
"__parse": true
},
"__parse": true
},
{
"id": "madrid",
"title": "Madrid",
"geometry": {
"type": "Point",
"coordinates": [-3.7033, 40.4167],
"__parse": true
},
"__parse": true
},
{
"id": "stockholm",
"title": "Stockholm",
"geometry": {
"type": "Point",
"coordinates": [18.0645, 59.3328],
"__parse": true
},
"__parse": true
},
{
"id": "bern",
"title": "Bern",
"geometry": {
"type": "Point",
"coordinates": [7.4481, 46.948],
"__parse": true
},
"__parse": true
},
{
"id": "kyiv",
"title": "Kyiv",
"geometry": {
"type": "Point",
"coordinates": [30.5367, 50.4422],
"__parse": true
},
"__parse": true
},
{
"id": "paris",
"title": "Paris",
"geometry": {
"type": "Point",
"coordinates": [2.351, 48.8567],
"__parse": true
},
"__parse": true
},
{
"id": "new york",
"title": "New York",
"geometry": {
"type": "Point",
"coordinates": [-74, 40.43],
"__parse": true
},
"__parse": true
}
]
},
{
"data-5": [
{
"lineId": "reykjavik",
"positionOnLine": 0.5,
"autoRotate": true
},
{
"lineId": "lisbon",
"positionOnLine": 0.5,
"autoRotate": true
},
{
"lineId": "moscow",
"positionOnLine": 0.5,
"autoRotate": true
},
{
"lineId": "belgrade",
"positionOnLine": 0.5,
"autoRotate": true
},
{
"lineId": "ljubljana",
"positionOnLine": 0.5,
"autoRotate": true
},
{
"lineId": "madrid",
"positionOnLine": 0.5,
"autoRotate": true
},
{
"lineId": "stockholm",
"positionOnLine": 0.5,
"autoRotate": true
},
{
"lineId": "bern",
"positionOnLine": 0.5,
"autoRotate": true
},
{
"lineId": "kyiv",
"positionOnLine": 0.5,
"autoRotate": true
},
{
"lineId": "new york",
"positionOnLine": 0.5,
"autoRotate": true
}
]
},
{
"series-0": {
"type": "MapPolygonSeries",
"settings": {
"affectsBounds": false
},
"properties": {
"data": "#data-0",
"mapPolygons": {
"properties": {
"template": {
"settings": {
"fill": "@root.interfaceColors.get('alternativeBackground')",
"fillOpacity": 0.05,
"strokeOpacity": 0
}
}
}
}
}
}
},
{
"series-1": {
"type": "MapRasterSeries",
"settings": {
"visible": false,
"affectsBounds": false
}
}
},
{
"series-2": {
"type": "MapPolygonSeries",
"settings": {
"name": "Polygon Series",
"geoJSON": "am5geodata_worldLow"
}
}
},
{
"series-3": {
"type": "GraticuleSeries",
"settings": {
"name": "Graticule Series"
},
"properties": {
"mapLines": {
"properties": {
"template": {
"settings": {
"stroke": "@root.interfaceColors.get('alternativeBackground')",
"strokeOpacity": 0.08
}
}
}
}
}
}
},
{
"series-5": {
"type": "MapPointSeries",
"settings": {
"name": "City Series"
},
"properties": {
"data": "#data-4",
"bullets": [
{
"type": "Bullet",
"settings": {
"sprite": {
"type": "Circle",
"settings": {
"radius": 5,
"tooltipText": "{title}",
"tooltipY": 0,
"fill": "@colors.getIndex(10)",
"stroke": "@root.interfaceColors.get('background')",
"strokeWidth": 2
}
}
}
}
]
}
}
},
{
"series-4": {
"type": "MapLineSeries",
"settings": {
"name": "Line Series",
"pointSeries": "#series-5"
},
"properties": {
"data": "#data-3",
"mapLines": {
"properties": {
"template": {
"settings": {
"stroke": "@root.interfaceColors.get('alternativeBackground')",
"strokeOpacity": 0.6
}
}
}
}
}
}
},
{
"series-6": {
"type": "MapPointSeries",
"settings": {
"name": "Arrow Series"
},
"properties": {
"data": "#data-5",
"bullets": [
{
"type": "Bullet",
"settings": {
"sprite": {
"type": "Graphics",
"settings": {
"fill": "@root.interfaceColors.get('alternativeBackground')",
"stroke": "@root.interfaceColors.get('alternativeBackground')",
"svgPath": "M0,-3 L8,0 L0,3 Z"
}
}
}
}
]
}
}
}
]
}

More map tools.
SVG Map Generator
Any region, any projection
Pick a map and projection, simplify it and paint regions, then export SVG or PNG.
Pixel Map Generator
Dotted and pixel-art maps
Turn any map into dots, squares, hexagons or diamonds for posters and slides.
SVG Maps
427 maps, free to download
World, continents, countries and regions, with every region as its own named path.