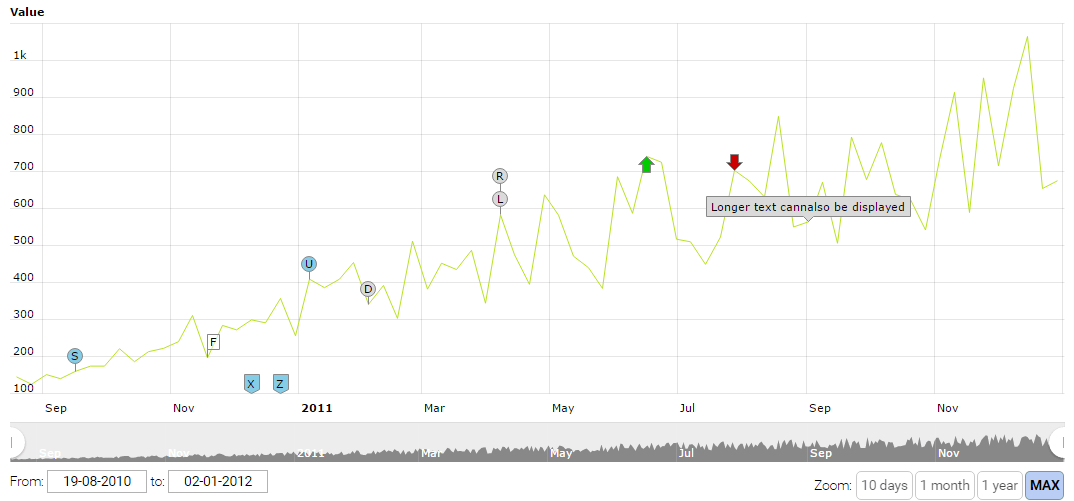
Stock Events
Our Stock chart can display different kind of annotations on the graph or on the axis. These annotations or stock events as we call them can mark important news or events connected to the security or bond. As you see, there is a wide variety of event types – they can look like a flag or sign or pin and have a letter inside or even contain more text. When user rolls-over the event, you can show a more detailed description or register this event and display some information outside the chart. The events are nicely stacked one on another if there is more than one for the same date.
Chart Scrollbar with a graph inside
In the bottom (it can also be on the top) of the chart you have a chart scrollbar which can be used to zoom-in or zoom-out the chart. This scrollbar can be just a simple one or have a graph inside it to show a rough view of how data changed over the whole period of the data available.
Demo source