Data grouping 50K points
A demo of amCharts 4, the previous version. For a new project, start from the amCharts 5 demos.
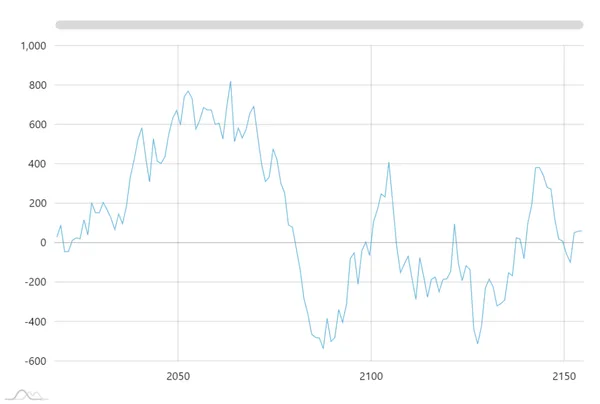
This demo shows how dynamic data item grouping - a feature built-in into amCharts 4 - can help coping with large data sets.
In a nutshell it ensures that no more than a fixed number of data items is displayed at any given time. The chart itself automatically adjusts data granularity, grouping data items into bigger periods.
When users zooms in, the granularity increases. This means that you can have a "bird's eye" view of the data when zoomed out without overwhelming number of items, and access detailed values for specific periods.
And, best of all, you're in control when specifying how aggregate values are calculated. It can be one of the absolute values like open, high, low, or close, or auto-calculated ones, like average or sum.
Read more about data item grouping
Code
JavaScript
// Themes begin
am4core.useTheme(am4themes_animated);
// Themes end

var chart = am4core.create("chartdiv", am4charts.XYChart);
chart.paddingRight = 20;

var data = [];
var visits = 10;
for (var i = 1; i < 50000; i++) {
  visits += Math.round((Math.random() < 0.5 ? 1 : -1) * Math.random() * 10);
  data.push({ date: new Date(2018, 0, i), value: visits });
}

chart.data = data;

var dateAxis = chart.xAxes.push(new am4charts.DateAxis());
dateAxis.renderer.grid.template.location = 0;
dateAxis.minZoomCount = 5;


// this makes the data to be grouped
dateAxis.groupData = true;
dateAxis.groupCount = 500;

var valueAxis = chart.yAxes.push(new am4charts.ValueAxis());

var series = chart.series.push(new am4charts.LineSeries());
series.dataFields.dateX = "date";
series.dataFields.valueY = "value";
series.tooltipText = "{valueY}";
series.tooltip.pointerOrientation = "vertical";
series.tooltip.background.fillOpacity = 0.5;

chart.cursor = new am4charts.XYCursor();
chart.cursor.xAxis = dateAxis;

var scrollbarX = new am4core.Scrollbar();
scrollbarX.marginBottom = 20;
chart.scrollbarX = scrollbarX;
HTML
<div id="chartdiv"></div>CSS
#chartdiv {
  width: 100%;
  height: 500px;
  max-width: 100%;
}
Resources
https://cdn.amcharts.com/lib/4/core.js
https://cdn.amcharts.com/lib/4/charts.js
https://cdn.amcharts.com/lib/4/themes/animated.js
All in one page
<!-- Resources -->
<script src="https://cdn.amcharts.com/lib/4/core.js"></script>
<script src="https://cdn.amcharts.com/lib/4/charts.js"></script>
<script src="https://cdn.amcharts.com/lib/4/themes/animated.js"></script>

<!-- Chart code -->
<script>
// Themes begin
am4core.useTheme(am4themes_animated);
// Themes end

var chart = am4core.create("chartdiv", am4charts.XYChart);
chart.paddingRight = 20;

var data = [];
var visits = 10;
for (var i = 1; i < 50000; i++) {
  visits += Math.round((Math.random() < 0.5 ? 1 : -1) * Math.random() * 10);
  data.push({ date: new Date(2018, 0, i), value: visits });
}

chart.data = data;

var dateAxis = chart.xAxes.push(new am4charts.DateAxis());
dateAxis.renderer.grid.template.location = 0;
dateAxis.minZoomCount = 5;


// this makes the data to be grouped
dateAxis.groupData = true;
dateAxis.groupCount = 500;

var valueAxis = chart.yAxes.push(new am4charts.ValueAxis());

var series = chart.series.push(new am4charts.LineSeries());
series.dataFields.dateX = "date";
series.dataFields.valueY = "value";
series.tooltipText = "{valueY}";
series.tooltip.pointerOrientation = "vertical";
series.tooltip.background.fillOpacity = 0.5;

chart.cursor = new am4charts.XYCursor();
chart.cursor.xAxis = dateAxis;

var scrollbarX = new am4core.Scrollbar();
scrollbarX.marginBottom = 20;
chart.scrollbarX = scrollbarX;
</script>

<!-- HTML -->
<div id="chartdiv"></div>