Pie Charts as Bullets
A demo of amCharts 4, the previous version. For a new project, start from the amCharts 5 demos.
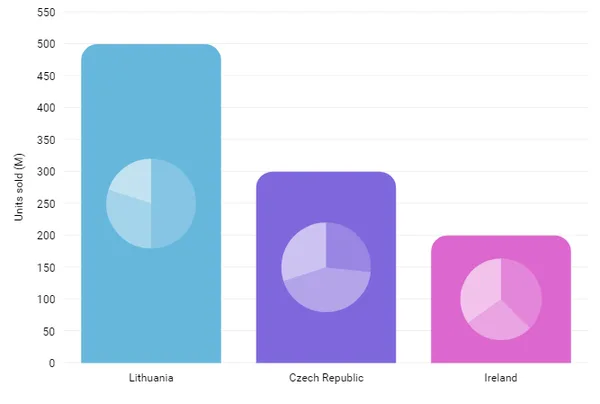
Open in:
Code
JavaScript
// Themes begin
am4core.useTheme(am4themes_animated);
// Themes end

var data = [{
  "country": "Lithuania",
  "units": 500,
  "pie": [{
    "value": 250,
    "title": "Cat #1"
  }, {
    "value": 150,
    "title": "Cat #2"
  }, {
    "value": 100,
    "title": "Cat #3"
  }]
}, {
  "country": "Czechia",
  "units": 300,
  "pie": [{
    "value": 80,
    "title": "Cat #1"
  }, {
    "value": 130,
    "title": "Cat #2"
  }, {
    "value": 90,
    "title": "Cat #3"
  }]
}, {
  "country": "Ireland",
  "units": 200,
  "pie": [{
    "value": 75,
    "title": "Cat #1"
  }, {
    "value": 55,
    "title": "Cat #2"
  }, {
    "value": 70,
    "title": "Cat #3"
  }]
}];


// Create chart instance
var chart = am4core.create("chartdiv", am4charts.XYChart);
chart.hiddenState.properties.opacity = 0; // this creates initial fade-in

// Add data
chart.data = data;

// Create axes
var categoryAxis = chart.xAxes.push(new am4charts.CategoryAxis());
categoryAxis.dataFields.category = "country";
categoryAxis.renderer.grid.template.disabled = true;

var valueAxis = chart.yAxes.push(new am4charts.ValueAxis());
valueAxis.title.text = "Units sold (M)";
valueAxis.min = 0;
valueAxis.renderer.baseGrid.disabled = true;
valueAxis.renderer.grid.template.strokeOpacity = 0.07;

// Create series
var series = chart.series.push(new am4charts.ColumnSeries());
series.dataFields.valueY = "units";
series.dataFields.categoryX = "country";
series.tooltip.pointerOrientation = "vertical";


var columnTemplate = series.columns.template;
// add tooltip on column, not template, so that slices could also have tooltip
columnTemplate.column.tooltipText = "Series: {name}\nCategory: {categoryX}\nValue: {valueY}";
columnTemplate.column.tooltipY = 0;
columnTemplate.column.cornerRadiusTopLeft = 20;
columnTemplate.column.cornerRadiusTopRight = 20;
columnTemplate.strokeOpacity = 0;


// as by default columns of the same series are of the same color, we add adapter which takes colors from chart.colors color set
columnTemplate.adapter.add("fill", function(fill, target) {
  var color = chart.colors.getIndex(target.dataItem.index * 3);
  return color;
});

// create pie chart as a column child
var pieChart = series.columns.template.createChild(am4charts.PieChart);
pieChart.width = am4core.percent(80);
pieChart.height = am4core.percent(80);
pieChart.align = "center";
pieChart.valign = "middle";
pieChart.dataFields.data = "pie";

var pieSeries = pieChart.series.push(new am4charts.PieSeries());
pieSeries.dataFields.value = "value";
pieSeries.dataFields.category = "title";
pieSeries.labels.template.disabled = true;
pieSeries.ticks.template.disabled = true;
pieSeries.slices.template.stroke = am4core.color("#ffffff");
pieSeries.slices.template.strokeWidth = 1;
pieSeries.slices.template.strokeOpacity = 0;

pieSeries.slices.template.adapter.add("fill", function(fill, target) {
  return am4core.color("#ffffff")
});

pieSeries.slices.template.adapter.add("fillOpacity", function(fillOpacity, target) {
  return (target.dataItem.index + 1) * 0.2;
});

pieSeries.hiddenState.properties.startAngle = -90;
pieSeries.hiddenState.properties.endAngle = 270;

var data = [{
  "country": "Lithuania",
  "units": 500,
  "pie": [{
    "value": 250,
    "title": "Cat #1"
  }, {
    "value": 150,
    "title": "Cat #2"
  }, {
    "value": 100,
    "title": "Cat #3"
  }]
}, {
  "country": "Czechia",
  "units": 300,
  "pie": [{
    "value": 80,
    "title": "Cat #1"
  }, {
    "value": 130,
    "title": "Cat #2"
  }, {
    "value": 90,
    "title": "Cat #3"
  }]
}, {
  "country": "Ireland",
  "units": 30,
  "pie": [{
    "value": 75,
    "title": "Cat #1"
  }, {
    "value": 55,
    "title": "Cat #2"
  }, {
    "value": 70,
    "title": "Cat #3"
  }]
}];


// Create chart instance
var chart = am4core.create("chartdiv", am4charts.XYChart);
chart.hiddenState.properties.opacity = 0; // this creates initial fade-in

// Add data
chart.data = data;

// Create axes
var categoryAxis = chart.xAxes.push(new am4charts.CategoryAxis());
categoryAxis.dataFields.category = "country";
categoryAxis.renderer.grid.template.disabled = true;

var valueAxis = chart.yAxes.push(new am4charts.ValueAxis());
valueAxis.title.text = "Units sold (M)";
valueAxis.min = 0;
valueAxis.renderer.baseGrid.disabled = true;
valueAxis.renderer.grid.template.strokeOpacity = 0.07;

// Create series
var series = chart.series.push(new am4charts.ColumnSeries());
series.dataFields.valueY = "units";
series.dataFields.categoryX = "country";
series.tooltip.pointerOrientation = "vertical";


var columnTemplate = series.columns.template;
// add tooltip on column, not template, so that slices could also have tooltip
columnTemplate.column.tooltipText = "Series: {name}\nCategory: {categoryX}\nValue: {valueY}";
columnTemplate.column.tooltipY = 0;
columnTemplate.column.cornerRadiusTopLeft = 20;
columnTemplate.column.cornerRadiusTopRight = 20;
columnTemplate.strokeOpacity = 0;


// as by default columns of the same series are of the same color, we add adapter which takes colors from chart.colors color set
columnTemplate.adapter.add("fill", function(fill, target) {
  var color = chart.colors.getIndex(target.dataItem.index * 3);
  return color;
});

// create pie chart as a column child
var pieChart = series.columns.template.createChild(am4charts.PieChart);
pieChart.width = am4core.percent(80);
pieChart.height = am4core.percent(80);
pieChart.align = "center";
pieChart.valign = "middle";
pieChart.dataFields.data = "pie";

var pieSeries = pieChart.series.push(new am4charts.PieSeries());
pieSeries.dataFields.value = "value";
pieSeries.dataFields.category = "title";
pieSeries.labels.template.disabled = true;
pieSeries.ticks.template.disabled = true;
pieSeries.slices.template.strokeWidth = 1;

pieSeries.slices.template.adapter.add("stroke", function(stroke, target) {
  return chart.colors.getIndex(target.parent.parent.dataItem.index * 3);
});

pieSeries.slices.template.adapter.add("fill", function(fill, target) {
  return am4core.color("#ffffff")
});

pieSeries.slices.template.adapter.add("fillOpacity", function(fillOpacity, target) {
  return (target.dataItem.index + 1) * 0.2;
});

pieSeries.hiddenState.properties.startAngle = -90;
pieSeries.hiddenState.properties.endAngle = 270;

// this moves the pie out of the column if column is too small
pieChart.adapter.add("verticalCenter", function(verticalCenter, target) {
  var point = am4core.utils.spritePointToSprite({ x: 0, y: 0 }, target.seriesContainer, chart.plotContainer);
  point.y -= target.dy;

  if (point.y > chart.plotContainer.measuredHeight - 15) {
    target.dy = -target.seriesContainer.measuredHeight - 15;
  }
  else {
    target.dy = 0;
  }
  return verticalCenter
})
JSON
// Themes begin
am4core.useTheme(am4themes_animated);
// Themes end

var chart = am4core.createFromConfig({

  "data": [{
    "country": "Lithuania",
    "units": 500,
    "pie": [{
      "value": 250,
      "title": "Cat #1"
    }, {
      "value": 150,
      "title": "Cat #2"
    }, {
      "value": 100,
      "title": "Cat #3"
    }]
  }, {
    "country": "Czechia",
    "units": 300,
    "pie": [{
      "value": 80,
      "title": "Cat #1"
    }, {
      "value": 130,
      "title": "Cat #2"
    }, {
      "value": 90,
      "title": "Cat #3"
    }]
  }, {
    "country": "Ireland",
    "units": 200,
    "pie": [{
      "value": 75,
      "title": "Cat #1"
    }, {
      "value": 55,
      "title": "Cat #2"
    }, {
      "value": 70,
      "title": "Cat #3"
    }]
  }],

  "hiddenState": {
    "properties": {
      "opacity": 0
    }
  },

  "xAxes": [{
    "type": "CategoryAxis",
    "dataFields": {
      "category": "country"
    },
    "renderer": {
      "grid": {
        "disabled": true
      }
    }
  }],

  "yAxes": [{
    "type": "ValueAxis",
    "title": {
      "text": "Units sold (M)",
    },
    "min": 0,
    "renderer": {
      "baseGrid": {
        "disabled": true
      },
      "grid": {
        "strokeOpacity": 0.07
      }
    }
  }],

  "series": [{
    "type": "ColumnSeries",
    "dataFields": {
      "valueY": "units",
      "categoryX": "country"
    },
    "tooltip": {
      "pointerOrientation": "vertical"
    },
    "columns": {
      "column": {
        "tooltipText": "Series: {name}\nCategory: {categoryX}\nValue: {valueY}",
        "tooltipY": 0,
        "cornerRadiusTopLeft": 20,
        "cornerRadiusTopRight": 20
      },
      "strokeOpacity": 0,
      "adapter": {
        "fill": function(fill, target) {
          var chart = target.dataItem.component.chart;
          var color = chart.colors.getIndex(target.dataItem.index * 3);
          return color;
        }
      },

      // pie
      "children": [{
        "type": "PieChart",
        "forceCreate": true,
        "width": "80%",
        "height": "80%",
        "align": "center",
        "valign": "middle",
        "dataFields": {
          "data": "pie"
        },
        "series": [{
          "type": "PieSeries",
          "dataFields": {
            "value": "value",
            "category": "title"
          },
          "labels": {
            "disabled": true
          },
          "ticks": {
            "disabled": true
          },
          "slices": {
            "stroke": "#ffffff",
            "strokeWidth": 1,
            "strokeOpacity": 0,
            "adapter": {
              "fill": function(fill, target) {
                return am4core.color("#ffffff");
              },
              "fillOpacity": function(fillOpacity, target) {
                return (target.dataItem.index + 1) * 0.2;
              }
            }
          },
          "hiddenState": {
            "properties": {
              "startAngle": -90,
              "endAngle": 270
            }
          }
        }]
      }]
    }
  }],

}, "chartdiv", "XYChart");
HTML
<div id="chartdiv"></div>
<div id="piechart1" class="asset"></div>
<div id="piechart2" class="asset"></div>
<div id="piechart3" class="asset"></div>
CSS
#chartdiv {
  width: 100%;
  height: 500px;
}
Resources
https://cdn.amcharts.com/lib/4/core.js
https://cdn.amcharts.com/lib/4/charts.js
https://cdn.amcharts.com/lib/4/themes/animated.js
All in one page
<!-- Resources -->
<script src="https://cdn.amcharts.com/lib/4/core.js"></script>
<script src="https://cdn.amcharts.com/lib/4/charts.js"></script>
<script src="https://cdn.amcharts.com/lib/4/themes/animated.js"></script>

<!-- Chart code -->
<script>
// Themes begin
am4core.useTheme(am4themes_animated);
// Themes end

var data = [{
  "country": "Lithuania",
  "units": 500,
  "pie": [{
    "value": 250,
    "title": "Cat #1"
  }, {
    "value": 150,
    "title": "Cat #2"
  }, {
    "value": 100,
    "title": "Cat #3"
  }]
}, {
  "country": "Czechia",
  "units": 300,
  "pie": [{
    "value": 80,
    "title": "Cat #1"
  }, {
    "value": 130,
    "title": "Cat #2"
  }, {
    "value": 90,
    "title": "Cat #3"
  }]
}, {
  "country": "Ireland",
  "units": 200,
  "pie": [{
    "value": 75,
    "title": "Cat #1"
  }, {
    "value": 55,
    "title": "Cat #2"
  }, {
    "value": 70,
    "title": "Cat #3"
  }]
}];


// Create chart instance
var chart = am4core.create("chartdiv", am4charts.XYChart);
chart.hiddenState.properties.opacity = 0; // this creates initial fade-in

// Add data
chart.data = data;

// Create axes
var categoryAxis = chart.xAxes.push(new am4charts.CategoryAxis());
categoryAxis.dataFields.category = "country";
categoryAxis.renderer.grid.template.disabled = true;

var valueAxis = chart.yAxes.push(new am4charts.ValueAxis());
valueAxis.title.text = "Units sold (M)";
valueAxis.min = 0;
valueAxis.renderer.baseGrid.disabled = true;
valueAxis.renderer.grid.template.strokeOpacity = 0.07;

// Create series
var series = chart.series.push(new am4charts.ColumnSeries());
series.dataFields.valueY = "units";
series.dataFields.categoryX = "country";
series.tooltip.pointerOrientation = "vertical";


var columnTemplate = series.columns.template;
// add tooltip on column, not template, so that slices could also have tooltip
columnTemplate.column.tooltipText = "Series: {name}\nCategory: {categoryX}\nValue: {valueY}";
columnTemplate.column.tooltipY = 0;
columnTemplate.column.cornerRadiusTopLeft = 20;
columnTemplate.column.cornerRadiusTopRight = 20;
columnTemplate.strokeOpacity = 0;


// as by default columns of the same series are of the same color, we add adapter which takes colors from chart.colors color set
columnTemplate.adapter.add("fill", function(fill, target) {
  var color = chart.colors.getIndex(target.dataItem.index * 3);
  return color;
});

// create pie chart as a column child
var pieChart = series.columns.template.createChild(am4charts.PieChart);
pieChart.width = am4core.percent(80);
pieChart.height = am4core.percent(80);
pieChart.align = "center";
pieChart.valign = "middle";
pieChart.dataFields.data = "pie";

var pieSeries = pieChart.series.push(new am4charts.PieSeries());
pieSeries.dataFields.value = "value";
pieSeries.dataFields.category = "title";
pieSeries.labels.template.disabled = true;
pieSeries.ticks.template.disabled = true;
pieSeries.slices.template.stroke = am4core.color("#ffffff");
pieSeries.slices.template.strokeWidth = 1;
pieSeries.slices.template.strokeOpacity = 0;

pieSeries.slices.template.adapter.add("fill", function(fill, target) {
  return am4core.color("#ffffff")
});

pieSeries.slices.template.adapter.add("fillOpacity", function(fillOpacity, target) {
  return (target.dataItem.index + 1) * 0.2;
});

pieSeries.hiddenState.properties.startAngle = -90;
pieSeries.hiddenState.properties.endAngle = 270;

var data = [{
  "country": "Lithuania",
  "units": 500,
  "pie": [{
    "value": 250,
    "title": "Cat #1"
  }, {
    "value": 150,
    "title": "Cat #2"
  }, {
    "value": 100,
    "title": "Cat #3"
  }]
}, {
  "country": "Czechia",
  "units": 300,
  "pie": [{
    "value": 80,
    "title": "Cat #1"
  }, {
    "value": 130,
    "title": "Cat #2"
  }, {
    "value": 90,
    "title": "Cat #3"
  }]
}, {
  "country": "Ireland",
  "units": 30,
  "pie": [{
    "value": 75,
    "title": "Cat #1"
  }, {
    "value": 55,
    "title": "Cat #2"
  }, {
    "value": 70,
    "title": "Cat #3"
  }]
}];


// Create chart instance
var chart = am4core.create("chartdiv", am4charts.XYChart);
chart.hiddenState.properties.opacity = 0; // this creates initial fade-in

// Add data
chart.data = data;

// Create axes
var categoryAxis = chart.xAxes.push(new am4charts.CategoryAxis());
categoryAxis.dataFields.category = "country";
categoryAxis.renderer.grid.template.disabled = true;

var valueAxis = chart.yAxes.push(new am4charts.ValueAxis());
valueAxis.title.text = "Units sold (M)";
valueAxis.min = 0;
valueAxis.renderer.baseGrid.disabled = true;
valueAxis.renderer.grid.template.strokeOpacity = 0.07;

// Create series
var series = chart.series.push(new am4charts.ColumnSeries());
series.dataFields.valueY = "units";
series.dataFields.categoryX = "country";
series.tooltip.pointerOrientation = "vertical";


var columnTemplate = series.columns.template;
// add tooltip on column, not template, so that slices could also have tooltip
columnTemplate.column.tooltipText = "Series: {name}\nCategory: {categoryX}\nValue: {valueY}";
columnTemplate.column.tooltipY = 0;
columnTemplate.column.cornerRadiusTopLeft = 20;
columnTemplate.column.cornerRadiusTopRight = 20;
columnTemplate.strokeOpacity = 0;


// as by default columns of the same series are of the same color, we add adapter which takes colors from chart.colors color set
columnTemplate.adapter.add("fill", function(fill, target) {
  var color = chart.colors.getIndex(target.dataItem.index * 3);
  return color;
});

// create pie chart as a column child
var pieChart = series.columns.template.createChild(am4charts.PieChart);
pieChart.width = am4core.percent(80);
pieChart.height = am4core.percent(80);
pieChart.align = "center";
pieChart.valign = "middle";
pieChart.dataFields.data = "pie";

var pieSeries = pieChart.series.push(new am4charts.PieSeries());
pieSeries.dataFields.value = "value";
pieSeries.dataFields.category = "title";
pieSeries.labels.template.disabled = true;
pieSeries.ticks.template.disabled = true;
pieSeries.slices.template.strokeWidth = 1;

pieSeries.slices.template.adapter.add("stroke", function(stroke, target) {
  return chart.colors.getIndex(target.parent.parent.dataItem.index * 3);
});

pieSeries.slices.template.adapter.add("fill", function(fill, target) {
  return am4core.color("#ffffff")
});

pieSeries.slices.template.adapter.add("fillOpacity", function(fillOpacity, target) {
  return (target.dataItem.index + 1) * 0.2;
});

pieSeries.hiddenState.properties.startAngle = -90;
pieSeries.hiddenState.properties.endAngle = 270;

// this moves the pie out of the column if column is too small
pieChart.adapter.add("verticalCenter", function(verticalCenter, target) {
  var point = am4core.utils.spritePointToSprite({ x: 0, y: 0 }, target.seriesContainer, chart.plotContainer);
  point.y -= target.dy;

  if (point.y > chart.plotContainer.measuredHeight - 15) {
    target.dy = -target.seriesContainer.measuredHeight - 15;
  }
  else {
    target.dy = 0;
  }
  return verticalCenter
})
</script>

<!-- HTML -->
<div id="chartdiv"></div>
<div id="piechart1" class="asset"></div>
<div id="piechart2" class="asset"></div>
<div id="piechart3" class="asset"></div>