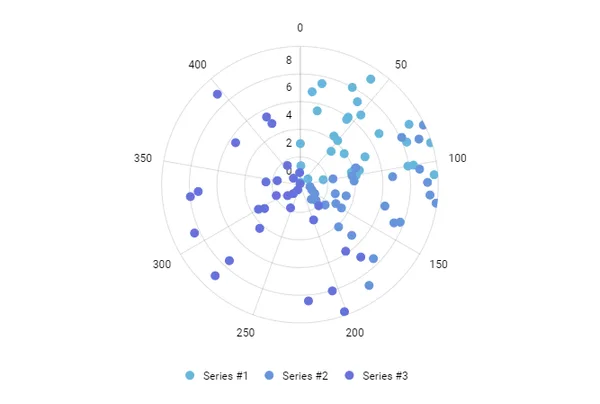
Polar Scatter
A demo of amCharts 4, the previous version. For a new project, start from the amCharts 5 demos.
Open in:
Code
JavaScript
// Themes begin
am4core.useTheme(am4themes_animated);
// Themes end

/* Create chart instance */
var chart = am4core.create("chartdiv", am4charts.RadarChart);

/* Add data */
chart.data = [{
  "country": "Lithuania",
  "litres": 501,
  "units": 250
}, {
  "country": "Czech Republic",
  "litres": 301,
  "units": 222
}, {
  "country": "Ireland",
  "litres": 266,
  "units": 179
}, {
  "country": "Germany",
  "litres": 165,
  "units": 298
}, {
  "country": "Australia",
  "litres": 139,
  "units": 299
}, {
  "country": "Austria",
  "litres": 336,
  "units": 185
}, {
  "country": "UK",
  "litres": 290,
  "units": 150
}, {
  "country": "Belgium",
  "litres": 325,
  "units": 382
}, {
  "country": "The Netherlands",
  "litres": 40,
  "units": 172
}];

/* Create axes */
var xAxis = chart.xAxes.push(new am4charts.ValueAxis());
xAxis.renderer.maxLabelPosition = 0.99;

var yAxis = chart.yAxes.push(new am4charts.ValueAxis());
yAxis.renderer.labels.template.verticalCenter = "bottom";
yAxis.renderer.labels.template.horizontalCenter = "right";
yAxis.renderer.maxLabelPosition = 0.99;
yAxis.renderer.labels.template.paddingBottom = 1;
yAxis.renderer.labels.template.paddingRight = 3;

/* Create and configure series */
var series1 = chart.series.push(new am4charts.RadarSeries());
series1.bullets.push(new am4charts.CircleBullet());
series1.strokeOpacity = 0;
series1.dataFields.valueX = "x";
series1.dataFields.valueY = "y";
series1.name = "Series #1";
series1.sequencedInterpolation = true;
series1.sequencedInterpolationDelay = 10;
series1.data = [
  { "x": 83, "y": 5.1 },
  { "x": 44, "y": 5.8 },
  { "x": 76, "y": 9 },
  { "x": 2, "y": 1.4 },
  { "x": 100, "y": 8.3 },
  { "x": 96, "y": 1.7 },
  { "x": 68, "y": 3.9 },
  { "x": 0, "y": 3 },
  { "x": 100, "y": 4.1 },
  { "x": 16, "y": 5.5 },
  { "x": 71, "y": 6.8 },
  { "x": 100, "y": 7.9 },
  { "x": 9, "y": 6.8 },
  { "x": 85, "y": 8.3 },
  { "x": 51, "y": 6.7 },
  { "x": 95, "y": 3.8 },
  { "x": 95, "y": 4.4 },
  { "x": 1, "y": 0.2 },
  { "x": 107, "y": 9.7 },
  { "x": 50, "y": 4.2 },
  { "x": 42, "y": 9.2 },
  { "x": 35, "y": 8 },
  { "x": 44, "y": 6 },
  { "x": 64, "y": 0.7 },
  { "x": 53, "y": 3.3 },
  { "x": 92, "y": 4.1 },
  { "x": 43, "y": 7.3 },
  { "x": 15, "y": 7.5 },
  { "x": 43, "y": 4.3 },
  { "x": 90, "y": 9.9 }
];

var series2 = chart.series.push(new am4charts.RadarSeries());
series2.bullets.push(new am4charts.CircleBullet());
series2.strokeOpacity = 0;
series2.dataFields.valueX = "x";
series2.dataFields.valueY = "y";
series2.name = "Series #2";
series2.sequencedInterpolation = true;
series2.sequencedInterpolationDelay = 10;
series2.data = [
  { "x": 178, "y": 1.3 },
  { "x": 129, "y": 3.4 },
  { "x": 99, "y": 2.4 },
  { "x": 80, "y": 9.9 },
  { "x": 118, "y": 9.4 },
  { "x": 103, "y": 8.7 },
  { "x": 91, "y": 4.2 },
  { "x": 151, "y": 1.2 },
  { "x": 168, "y": 5.2 },
  { "x": 168, "y": 1.6 },
  { "x": 152, "y": 1.2 },
  { "x": 149, "y": 3.4 },
  { "x": 182, "y": 8.8 },
  { "x": 106, "y": 6.7 },
  { "x": 111, "y": 9.2 },
  { "x": 130, "y": 6.3 },
  { "x": 147, "y": 2.9 },
  { "x": 81, "y": 8.1 },
  { "x": 138, "y": 7.7 },
  { "x": 107, "y": 3.9 },
  { "x": 124, "y": 0.7 },
  { "x": 130, "y": 2.6 },
  { "x": 86, "y": 9.2 },
  { "x": 169, "y": 7.5 },
  { "x": 122, "y": 9.9 },
  { "x": 100, "y": 3.8 },
  { "x": 172, "y": 4.1 },
  { "x": 140, "y": 7.3 },
  { "x": 161, "y": 2.3 },
  { "x": 141, "y": 0.9 }
];

var series3 = chart.series.push(new am4charts.RadarSeries());
series3.bullets.push(new am4charts.CircleBullet());
series3.strokeOpacity = 0;
series3.dataFields.valueX = "x";
series3.dataFields.valueY = "y";
series3.name = "Series #3";
series3.sequencedInterpolation = true;
series3.sequencedInterpolationDelay = 10;
series3.data = [
  { "x": 419, "y": 4.9 },
  { "x": 417, "y": 5.5 },
  { "x": 434, "y": 0.1 },
  { "x": 344, "y": 2.5 },
  { "x": 279, "y": 7.5 },
  { "x": 307, "y": 8.4 },
  { "x": 279, "y": 9 },
  { "x": 220, "y": 8.4 },
  { "x": 204, "y": 8 },
  { "x": 446, "y": 0.9 },
  { "x": 397, "y": 8.9 },
  { "x": 351, "y": 1.7 },
  { "x": 393, "y": 0.7 },
  { "x": 254, "y": 1.8 },
  { "x": 260, "y": 0.4 },
  { "x": 300, "y": 3.5 },
  { "x": 199, "y": 2.7 },
  { "x": 182, "y": 5.8 },
  { "x": 173, "y": 2 },
  { "x": 201, "y": 9.7 },
  { "x": 288, "y": 1.2 },
  { "x": 333, "y": 7.4 },
  { "x": 308, "y": 1.9 },
  { "x": 330, "y": 8 },
  { "x": 408, "y": 1.7 },
  { "x": 274, "y": 0.8 },
  { "x": 296, "y": 3.1 },
  { "x": 279, "y": 4.3 },
  { "x": 379, "y": 5.6 },
  { "x": 175, "y": 6.8 }
];

/* Add legend */
chart.legend = new am4charts.Legend();

/* Add cursor */
chart.cursor = new am4charts.RadarCursor();
HTML
<div id="chartdiv"></div>CSS
#chartdiv {
  width: 100%;
  height: 500px;
}
Resources
https://cdn.amcharts.com/lib/4/core.js
https://cdn.amcharts.com/lib/4/charts.js
https://cdn.amcharts.com/lib/4/themes/animated.js
All in one page
<!-- Resources -->
<script src="https://cdn.amcharts.com/lib/4/core.js"></script>
<script src="https://cdn.amcharts.com/lib/4/charts.js"></script>
<script src="https://cdn.amcharts.com/lib/4/themes/animated.js"></script>

<!-- Chart code -->
<script>
// Themes begin
am4core.useTheme(am4themes_animated);
// Themes end

/* Create chart instance */
var chart = am4core.create("chartdiv", am4charts.RadarChart);

/* Add data */
chart.data = [{
  "country": "Lithuania",
  "litres": 501,
  "units": 250
}, {
  "country": "Czech Republic",
  "litres": 301,
  "units": 222
}, {
  "country": "Ireland",
  "litres": 266,
  "units": 179
}, {
  "country": "Germany",
  "litres": 165,
  "units": 298
}, {
  "country": "Australia",
  "litres": 139,
  "units": 299
}, {
  "country": "Austria",
  "litres": 336,
  "units": 185
}, {
  "country": "UK",
  "litres": 290,
  "units": 150
}, {
  "country": "Belgium",
  "litres": 325,
  "units": 382
}, {
  "country": "The Netherlands",
  "litres": 40,
  "units": 172
}];

/* Create axes */
var xAxis = chart.xAxes.push(new am4charts.ValueAxis());
xAxis.renderer.maxLabelPosition = 0.99;

var yAxis = chart.yAxes.push(new am4charts.ValueAxis());
yAxis.renderer.labels.template.verticalCenter = "bottom";
yAxis.renderer.labels.template.horizontalCenter = "right";
yAxis.renderer.maxLabelPosition = 0.99;
yAxis.renderer.labels.template.paddingBottom = 1;
yAxis.renderer.labels.template.paddingRight = 3;

/* Create and configure series */
var series1 = chart.series.push(new am4charts.RadarSeries());
series1.bullets.push(new am4charts.CircleBullet());
series1.strokeOpacity = 0;
series1.dataFields.valueX = "x";
series1.dataFields.valueY = "y";
series1.name = "Series #1";
series1.sequencedInterpolation = true;
series1.sequencedInterpolationDelay = 10;
series1.data = [
  { "x": 83, "y": 5.1 },
  { "x": 44, "y": 5.8 },
  { "x": 76, "y": 9 },
  { "x": 2, "y": 1.4 },
  { "x": 100, "y": 8.3 },
  { "x": 96, "y": 1.7 },
  { "x": 68, "y": 3.9 },
  { "x": 0, "y": 3 },
  { "x": 100, "y": 4.1 },
  { "x": 16, "y": 5.5 },
  { "x": 71, "y": 6.8 },
  { "x": 100, "y": 7.9 },
  { "x": 9, "y": 6.8 },
  { "x": 85, "y": 8.3 },
  { "x": 51, "y": 6.7 },
  { "x": 95, "y": 3.8 },
  { "x": 95, "y": 4.4 },
  { "x": 1, "y": 0.2 },
  { "x": 107, "y": 9.7 },
  { "x": 50, "y": 4.2 },
  { "x": 42, "y": 9.2 },
  { "x": 35, "y": 8 },
  { "x": 44, "y": 6 },
  { "x": 64, "y": 0.7 },
  { "x": 53, "y": 3.3 },
  { "x": 92, "y": 4.1 },
  { "x": 43, "y": 7.3 },
  { "x": 15, "y": 7.5 },
  { "x": 43, "y": 4.3 },
  { "x": 90, "y": 9.9 }
];

var series2 = chart.series.push(new am4charts.RadarSeries());
series2.bullets.push(new am4charts.CircleBullet());
series2.strokeOpacity = 0;
series2.dataFields.valueX = "x";
series2.dataFields.valueY = "y";
series2.name = "Series #2";
series2.sequencedInterpolation = true;
series2.sequencedInterpolationDelay = 10;
series2.data = [
  { "x": 178, "y": 1.3 },
  { "x": 129, "y": 3.4 },
  { "x": 99, "y": 2.4 },
  { "x": 80, "y": 9.9 },
  { "x": 118, "y": 9.4 },
  { "x": 103, "y": 8.7 },
  { "x": 91, "y": 4.2 },
  { "x": 151, "y": 1.2 },
  { "x": 168, "y": 5.2 },
  { "x": 168, "y": 1.6 },
  { "x": 152, "y": 1.2 },
  { "x": 149, "y": 3.4 },
  { "x": 182, "y": 8.8 },
  { "x": 106, "y": 6.7 },
  { "x": 111, "y": 9.2 },
  { "x": 130, "y": 6.3 },
  { "x": 147, "y": 2.9 },
  { "x": 81, "y": 8.1 },
  { "x": 138, "y": 7.7 },
  { "x": 107, "y": 3.9 },
  { "x": 124, "y": 0.7 },
  { "x": 130, "y": 2.6 },
  { "x": 86, "y": 9.2 },
  { "x": 169, "y": 7.5 },
  { "x": 122, "y": 9.9 },
  { "x": 100, "y": 3.8 },
  { "x": 172, "y": 4.1 },
  { "x": 140, "y": 7.3 },
  { "x": 161, "y": 2.3 },
  { "x": 141, "y": 0.9 }
];

var series3 = chart.series.push(new am4charts.RadarSeries());
series3.bullets.push(new am4charts.CircleBullet());
series3.strokeOpacity = 0;
series3.dataFields.valueX = "x";
series3.dataFields.valueY = "y";
series3.name = "Series #3";
series3.sequencedInterpolation = true;
series3.sequencedInterpolationDelay = 10;
series3.data = [
  { "x": 419, "y": 4.9 },
  { "x": 417, "y": 5.5 },
  { "x": 434, "y": 0.1 },
  { "x": 344, "y": 2.5 },
  { "x": 279, "y": 7.5 },
  { "x": 307, "y": 8.4 },
  { "x": 279, "y": 9 },
  { "x": 220, "y": 8.4 },
  { "x": 204, "y": 8 },
  { "x": 446, "y": 0.9 },
  { "x": 397, "y": 8.9 },
  { "x": 351, "y": 1.7 },
  { "x": 393, "y": 0.7 },
  { "x": 254, "y": 1.8 },
  { "x": 260, "y": 0.4 },
  { "x": 300, "y": 3.5 },
  { "x": 199, "y": 2.7 },
  { "x": 182, "y": 5.8 },
  { "x": 173, "y": 2 },
  { "x": 201, "y": 9.7 },
  { "x": 288, "y": 1.2 },
  { "x": 333, "y": 7.4 },
  { "x": 308, "y": 1.9 },
  { "x": 330, "y": 8 },
  { "x": 408, "y": 1.7 },
  { "x": 274, "y": 0.8 },
  { "x": 296, "y": 3.1 },
  { "x": 279, "y": 4.3 },
  { "x": 379, "y": 5.6 },
  { "x": 175, "y": 6.8 }
];

/* Add legend */
chart.legend = new am4charts.Legend();

/* Add cursor */
chart.cursor = new am4charts.RadarCursor();
</script>

<!-- HTML -->
<div id="chartdiv"></div>