Semi-circle Pie chart
A demo of amCharts 4, the previous version. See it in amCharts 5.
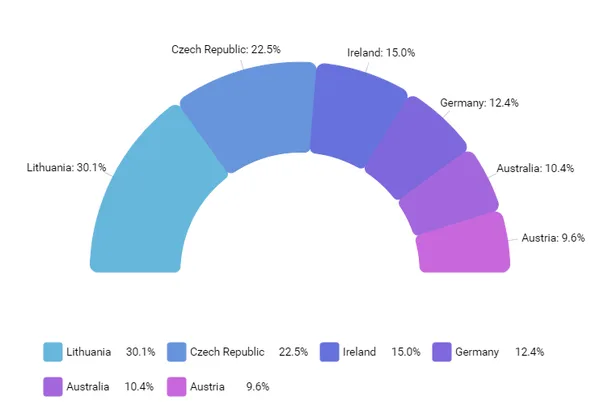
The main advantage of the Semi-Circle Pie Chart (also known as Semi-circle donut chart, Half pie chart) is that it takes two times less space than the regular Pie or Donut Chart for the same amount of data displayed.
Flexible pie chart
Pie chart is not limited to a full circle. You can set any angle for it to start on and any angle to end on. The chart will take care of the rest.
The chart's properties startAngle and endAngle are responsible for it.
This is the amCharts 4 version. See this demo in amCharts 5
Open in:
Code
JavaScript
// Themes begin
am4core.useTheme(am4themes_animated);
// Themes end

var chart = am4core.create("chartdiv", am4charts.PieChart);
chart.hiddenState.properties.opacity = 0; // this creates initial fade-in

chart.data = [
  {
    country: "Lithuania",
    value: 401
  },
  {
    country: "Czech Republic",
    value: 300
  },
  {
    country: "Ireland",
    value: 200
  },
  {
    country: "Germany",
    value: 165
  },
  {
    country: "Australia",
    value: 139
  },
  {
    country: "Austria",
    value: 128
  }
];
chart.radius = am4core.percent(70);
chart.innerRadius = am4core.percent(40);
chart.startAngle = 180;
chart.endAngle = 360;

var series = chart.series.push(new am4charts.PieSeries());
series.dataFields.value = "value";
series.dataFields.category = "country";

series.slices.template.cornerRadius = 10;
series.slices.template.innerCornerRadius = 7;
series.slices.template.draggable = true;
series.slices.template.inert = true;
series.alignLabels = false;

series.hiddenState.properties.startAngle = 90;
series.hiddenState.properties.endAngle = 90;

chart.legend = new am4charts.Legend();
HTML
<div id="chartdiv"></div>CSS
#chartdiv {
  width: 100%;
  height: 500px;
}
Resources
https://cdn.amcharts.com/lib/4/core.js
https://cdn.amcharts.com/lib/4/charts.js
https://cdn.amcharts.com/lib/4/themes/animated.js
All in one page
<!-- Resources -->
<script src="https://cdn.amcharts.com/lib/4/core.js"></script>
<script src="https://cdn.amcharts.com/lib/4/charts.js"></script>
<script src="https://cdn.amcharts.com/lib/4/themes/animated.js"></script>

<!-- Chart code -->
<script>
// Themes begin
am4core.useTheme(am4themes_animated);
// Themes end

var chart = am4core.create("chartdiv", am4charts.PieChart);
chart.hiddenState.properties.opacity = 0; // this creates initial fade-in

chart.data = [
  {
    country: "Lithuania",
    value: 401
  },
  {
    country: "Czech Republic",
    value: 300
  },
  {
    country: "Ireland",
    value: 200
  },
  {
    country: "Germany",
    value: 165
  },
  {
    country: "Australia",
    value: 139
  },
  {
    country: "Austria",
    value: 128
  }
];
chart.radius = am4core.percent(70);
chart.innerRadius = am4core.percent(40);
chart.startAngle = 180;
chart.endAngle = 360;

var series = chart.series.push(new am4charts.PieSeries());
series.dataFields.value = "value";
series.dataFields.category = "country";

series.slices.template.cornerRadius = 10;
series.slices.template.innerCornerRadius = 7;
series.slices.template.draggable = true;
series.slices.template.inert = true;
series.alignLabels = false;

series.hiddenState.properties.startAngle = 90;
series.hiddenState.properties.endAngle = 90;

chart.legend = new am4charts.Legend();
</script>

<!-- HTML -->
<div id="chartdiv"></div>