Variance indicators
A demo of amCharts 4, the previous version. For a new project, start from the amCharts 5 demos.
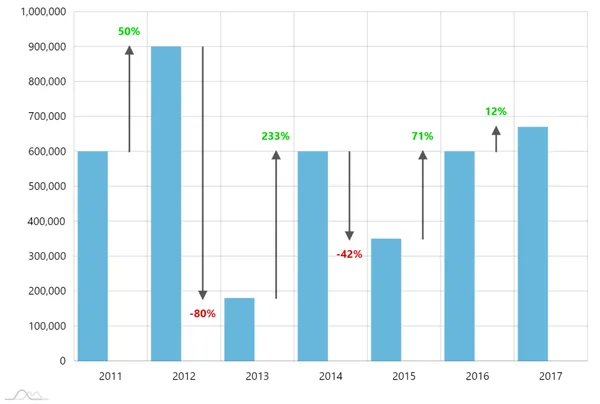
A clever use of highly configurable clustered Column series and adapters allows automatically-calculated variance indicators.
Open in:
Code
JavaScript
// Themes begin
am4core.useTheme(am4themes_animated);
// Themes end

// Create chart instance
var chart = am4core.create("chartdiv", am4charts.XYChart);

// Add data
chart.data = [{
	"year": "2011",
	"value": 600000
}, {
	"year": "2012",
	"value": 900000
}, {
	"year": "2013",
	"value": 180000
}, {
	"year": "2014",
	"value": 600000
}, {
	"year": "2015",
	"value": 350000
}, {
	"year": "2016",
	"value": 600000
}, {
	"year": "2017",
	"value": 670000
}];

// Populate data
for (var i = 0; i < (chart.data.length - 1); i++) {
	chart.data[i].valueNext = chart.data[i + 1].value;
}

// Create axes
var categoryAxis = chart.xAxes.push(new am4charts.CategoryAxis());
categoryAxis.dataFields.category = "year";
categoryAxis.renderer.grid.template.location = 0;
categoryAxis.renderer.minGridDistance = 30;

var valueAxis = chart.yAxes.push(new am4charts.ValueAxis());
valueAxis.min = 0;

// Create series
var series = chart.series.push(new am4charts.ColumnSeries());
series.dataFields.valueY = "value";
series.dataFields.categoryX = "year";

// Add series for showing variance arrows
var series2 = chart.series.push(new am4charts.ColumnSeries());
series2.dataFields.valueY = "valueNext";
series2.dataFields.openValueY = "value";
series2.dataFields.categoryX = "year";
series2.columns.template.width = 1;
series2.fill = am4core.color("#555");
series2.stroke = am4core.color("#555");

// Add a triangle for arrow tip
var arrow = series2.bullets.push(new am4core.Triangle);
arrow.width = 10;
arrow.height = 10;
arrow.horizontalCenter = "middle";
arrow.verticalCenter = "top";
arrow.dy = -1;

// Set up a rotation adapter which would rotate the triangle if its a negative change
arrow.adapter.add("rotation", function(rotation, target) {
	return getVariancePercent(target.dataItem) < 0 ? 180 : rotation;
});

// Set up a rotation adapter which adjusts Y position
arrow.adapter.add("dy", function(dy, target) {
	return getVariancePercent(target.dataItem) < 0 ? 1 : dy;
});

// Add a label
var label = series2.bullets.push(new am4core.Label);
label.padding(10, 10, 10, 10);
label.text = "";
label.fill = am4core.color("#0c0");
label.strokeWidth = 0;
label.horizontalCenter = "middle";
label.verticalCenter = "bottom";
label.fontWeight = "bolder";

// Adapter for label text which calculates change in percent
label.adapter.add("textOutput", function(text, target) {
	var percent = getVariancePercent(target.dataItem);
	return percent ? percent + "%" : text;
});

// Adapter which shifts the label if it's below the variance column
label.adapter.add("verticalCenter", function(center, target) {
	return getVariancePercent(target.dataItem) < 0 ? "top" : center;
});

// Adapter which changes color of label to red
label.adapter.add("fill", function(fill, target) {
	return getVariancePercent(target.dataItem) < 0 ? am4core.color("#c00") : fill;
});

function getVariancePercent(dataItem) {
	if (dataItem) {
		var value = dataItem.valueY;
		var openValue = dataItem.openValueY;
		var change = value - openValue;
		return Math.round(change / openValue * 100);
	}
	return 0;
}
HTML
<div id="chartdiv"></div>CSS
#chartdiv {
  width: 100%;
  height: 350px;
}
Resources
https://cdn.amcharts.com/lib/4/core.js
https://cdn.amcharts.com/lib/4/charts.js
https://cdn.amcharts.com/lib/4/themes/animated.js
All in one page
<!-- Resources -->
<script src="https://cdn.amcharts.com/lib/4/core.js"></script>
<script src="https://cdn.amcharts.com/lib/4/charts.js"></script>
<script src="https://cdn.amcharts.com/lib/4/themes/animated.js"></script>

<!-- Chart code -->
<script>
// Themes begin
am4core.useTheme(am4themes_animated);
// Themes end

// Create chart instance
var chart = am4core.create("chartdiv", am4charts.XYChart);

// Add data
chart.data = [{
	"year": "2011",
	"value": 600000
}, {
	"year": "2012",
	"value": 900000
}, {
	"year": "2013",
	"value": 180000
}, {
	"year": "2014",
	"value": 600000
}, {
	"year": "2015",
	"value": 350000
}, {
	"year": "2016",
	"value": 600000
}, {
	"year": "2017",
	"value": 670000
}];

// Populate data
for (var i = 0; i < (chart.data.length - 1); i++) {
	chart.data[i].valueNext = chart.data[i + 1].value;
}

// Create axes
var categoryAxis = chart.xAxes.push(new am4charts.CategoryAxis());
categoryAxis.dataFields.category = "year";
categoryAxis.renderer.grid.template.location = 0;
categoryAxis.renderer.minGridDistance = 30;

var valueAxis = chart.yAxes.push(new am4charts.ValueAxis());
valueAxis.min = 0;

// Create series
var series = chart.series.push(new am4charts.ColumnSeries());
series.dataFields.valueY = "value";
series.dataFields.categoryX = "year";

// Add series for showing variance arrows
var series2 = chart.series.push(new am4charts.ColumnSeries());
series2.dataFields.valueY = "valueNext";
series2.dataFields.openValueY = "value";
series2.dataFields.categoryX = "year";
series2.columns.template.width = 1;
series2.fill = am4core.color("#555");
series2.stroke = am4core.color("#555");

// Add a triangle for arrow tip
var arrow = series2.bullets.push(new am4core.Triangle);
arrow.width = 10;
arrow.height = 10;
arrow.horizontalCenter = "middle";
arrow.verticalCenter = "top";
arrow.dy = -1;

// Set up a rotation adapter which would rotate the triangle if its a negative change
arrow.adapter.add("rotation", function(rotation, target) {
	return getVariancePercent(target.dataItem) < 0 ? 180 : rotation;
});

// Set up a rotation adapter which adjusts Y position
arrow.adapter.add("dy", function(dy, target) {
	return getVariancePercent(target.dataItem) < 0 ? 1 : dy;
});

// Add a label
var label = series2.bullets.push(new am4core.Label);
label.padding(10, 10, 10, 10);
label.text = "";
label.fill = am4core.color("#0c0");
label.strokeWidth = 0;
label.horizontalCenter = "middle";
label.verticalCenter = "bottom";
label.fontWeight = "bolder";

// Adapter for label text which calculates change in percent
label.adapter.add("textOutput", function(text, target) {
	var percent = getVariancePercent(target.dataItem);
	return percent ? percent + "%" : text;
});

// Adapter which shifts the label if it's below the variance column
label.adapter.add("verticalCenter", function(center, target) {
	return getVariancePercent(target.dataItem) < 0 ? "top" : center;
});

// Adapter which changes color of label to red
label.adapter.add("fill", function(fill, target) {
	return getVariancePercent(target.dataItem) < 0 ? am4core.color("#c00") : fill;
});

function getVariancePercent(dataItem) {
	if (dataItem) {
		var value = dataItem.valueY;
		var openValue = dataItem.openValueY;
		var change = value - openValue;
		return Math.round(change / openValue * 100);
	}
	return 0;
}
</script>

<!-- HTML -->
<div id="chartdiv"></div>