World Clock
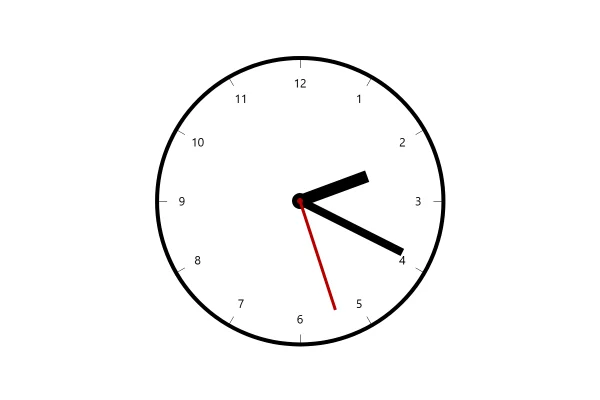
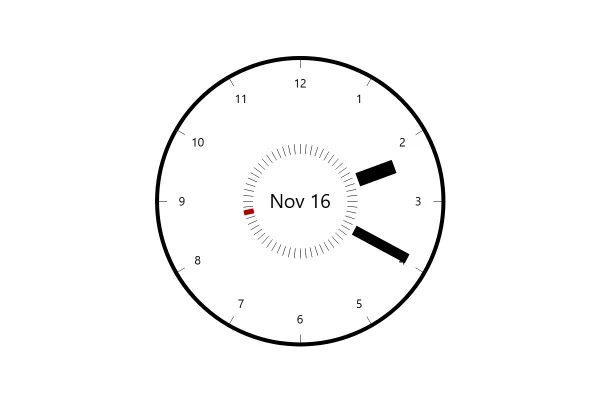
Your time next to New York, London and Tokyo on four live analog clocks, with the time in digits, how far ahead or behind, and a dark face at night.
About this chart
One moment, four places
Each clock is its own gauge chart: a circular axis from 0 to 12 with three clock hands, laid out four in a row, or two by two on a phone. The browser converts the same moment to each city's time zone, so there is no time zone data to keep up to date, and summer time changes by itself.
Good for
- Office walls and reception screens
- Teams spread across time zones
- Dashboards for global operations
Think twice when
- Many cities: a table of times reads faster
- Planning across zones: show dates and hours together
- Small spaces: one line of digits takes less room
For developers
Get the code.
Built with amCharts 5, a JavaScript library. The code includes your theme and renderer (canvas or SVG), but not the changes you make with the controls.
For projects that use npm:
How it reads:
Using Claude or ChatGPT? Install the amCharts plugin first (Claude, ChatGPT), so it works from our docs and examples.
npm install @amcharts/amcharts5 and @amcharts/amcharts5-geodata. See Getting started.
The same chart as a JSON config. Chart Maker reads and writes this format, the library's JSON parser turns it into a chart, and the <am5-chart> element puts it on a page with no code.How it reads:
"type" is the class to create and "settings" what you would pass to its new() in code; "properties" fill in its parts, lists such as series and axes or templates such as columns.template; "refs" holds objects used in more than one place ("#series-0" stands for the one named series-0); a string starting with "@" takes a value from another object, such as "@series.get('fill')".
A complete page. Save it as an .html file and open it in a browser.
Paste this into an AI coding assistant to build the chart from scratch. More in amCharts & AI.Using Claude or ChatGPT? Install the amCharts plugin first (Claude, ChatGPT), so it works from our docs and examples.
// Create root element
// https://docs.amcharts.com/v5/getting-started/#root-element
var root = am5.Root.new("chartdiv");

// Set themes
// https://docs.amcharts.com/v5/concepts/themes/
root.setThemes([
  am5themes_Animated.new(root),
  am5themes_ResponsiveMax.new(root)
]);

// The cities this demo knows: [name, latitude, longitude, time zone]. They put the clocks on the map, and find your
// own city by your browser's time zone
var CITIES = [
  ["New York", 40.71, -74.01, "America/New_York"], ["Washington", 38.91, -77.04, "America/New_York"],
  ["Miami", 25.76, -80.19, "America/New_York"], ["Toronto", 43.65, -79.38, "America/Toronto"],
  ["Montreal", 45.50, -73.57, "America/Toronto"], ["Halifax", 44.65, -63.57, "America/Halifax"],
  ["Chicago", 41.88, -87.63, "America/Chicago"], ["Houston", 29.76, -95.37, "America/Chicago"],
  ["Mexico City", 19.43, -99.13, "America/Mexico_City"], ["Denver", 39.74, -104.99, "America/Denver"],
  ["Phoenix", 33.45, -112.07, "America/Phoenix"], ["Los Angeles", 34.05, -118.24, "America/Los_Angeles"],
  ["San Francisco", 37.77, -122.42, "America/Los_Angeles"], ["Seattle", 47.61, -122.33, "America/Los_Angeles"],
  ["Vancouver", 49.28, -123.12, "America/Vancouver"], ["Anchorage", 61.22, -149.90, "America/Anchorage"],
  ["Honolulu", 21.31, -157.86, "Pacific/Honolulu"], ["Bogotá", 4.71, -74.07, "America/Bogota"],
  ["Lima", -12.05, -77.04, "America/Lima"], ["Caracas", 10.48, -66.90, "America/Caracas"],
  ["Santiago", -33.45, -70.67, "America/Santiago"], ["Buenos Aires", -34.60, -58.38, "America/Argentina/Buenos_Aires"],
  ["São Paulo", -23.55, -46.63, "America/Sao_Paulo"], ["Reykjavík", 64.15, -21.94, "Atlantic/Reykjavik"],
  ["London", 51.51, -0.13, "Europe/London"], ["Dublin", 53.35, -6.26, "Europe/Dublin"],
  ["Lisbon", 38.72, -9.14, "Europe/Lisbon"], ["Madrid", 40.42, -3.70, "Europe/Madrid"],
  ["Paris", 48.86, 2.35, "Europe/Paris"], ["Brussels", 50.85, 4.35, "Europe/Brussels"],
  ["Amsterdam", 52.37, 4.90, "Europe/Amsterdam"], ["Zurich", 47.38, 8.54, "Europe/Zurich"],
  ["Berlin", 52.52, 13.40, "Europe/Berlin"], ["Rome", 41.90, 12.50, "Europe/Rome"],
  ["Vienna", 48.21, 16.37, "Europe/Vienna"], ["Prague", 50.08, 14.44, "Europe/Prague"],
  ["Copenhagen", 55.68, 12.57, "Europe/Copenhagen"], ["Oslo", 59.91, 10.75, "Europe/Oslo"],
  ["Stockholm", 59.33, 18.07, "Europe/Stockholm"], ["Warsaw", 52.23, 21.01, "Europe/Warsaw"],
  ["Budapest", 47.50, 19.04, "Europe/Budapest"], ["Belgrade", 44.79, 20.45, "Europe/Belgrade"],
  ["Helsinki", 60.17, 24.94, "Europe/Helsinki"], ["Tallinn", 59.44, 24.75, "Europe/Tallinn"],
  ["Riga", 56.95, 24.11, "Europe/Riga"], ["Vilnius", 54.69, 25.28, "Europe/Vilnius"],
  ["Kyiv", 50.45, 30.52, "Europe/Kyiv"], ["Bucharest", 44.43, 26.10, "Europe/Bucharest"],
  ["Sofia", 42.70, 23.32, "Europe/Sofia"], ["Athens", 37.98, 23.73, "Europe/Athens"],
  ["Istanbul", 41.01, 28.98, "Europe/Istanbul"], ["Moscow", 55.76, 37.62, "Europe/Moscow"],
  ["Casablanca", 33.57, -7.59, "Africa/Casablanca"], ["Accra", 5.60, -0.19, "Africa/Accra"],
  ["Lagos", 6.52, 3.38, "Africa/Lagos"], ["Cairo", 30.04, 31.24, "Africa/Cairo"],
  ["Addis Ababa", 9.03, 38.74, "Africa/Addis_Ababa"], ["Nairobi", -1.29, 36.82, "Africa/Nairobi"],
  ["Johannesburg", -26.20, 28.05, "Africa/Johannesburg"], ["Cape Town", -33.92, 18.42, "Africa/Johannesburg"],
  ["Tel Aviv", 32.09, 34.78, "Asia/Jerusalem"], ["Riyadh", 24.71, 46.68, "Asia/Riyadh"],
  ["Doha", 25.29, 51.53, "Asia/Qatar"], ["Dubai", 25.20, 55.27, "Asia/Dubai"],
  ["Tehran", 35.69, 51.39, "Asia/Tehran"], ["Karachi", 24.86, 67.01, "Asia/Karachi"],
  ["Tashkent", 41.30, 69.24, "Asia/Tashkent"], ["Almaty", 43.24, 76.89, "Asia/Almaty"],
  ["Delhi", 28.61, 77.21, "Asia/Kolkata"], ["Mumbai", 19.08, 72.88, "Asia/Kolkata"],
  ["Bangalore", 12.97, 77.59, "Asia/Kolkata"], ["Kathmandu", 27.72, 85.32, "Asia/Kathmandu"],
  ["Dhaka", 23.81, 90.41, "Asia/Dhaka"], ["Bangkok", 13.76, 100.50, "Asia/Bangkok"],
  ["Ho Chi Minh City", 10.82, 106.63, "Asia/Ho_Chi_Minh"], ["Kuala Lumpur", 3.14, 101.69, "Asia/Kuala_Lumpur"],
  ["Singapore", 1.35, 103.82, "Asia/Singapore"], ["Jakarta", -6.21, 106.85, "Asia/Jakarta"],
  ["Manila", 14.60, 120.98, "Asia/Manila"], ["Hong Kong", 22.32, 114.17, "Asia/Hong_Kong"],
  ["Shanghai", 31.23, 121.47, "Asia/Shanghai"], ["Beijing", 39.90, 116.41, "Asia/Shanghai"],
  ["Taipei", 25.03, 121.57, "Asia/Taipei"], ["Seoul", 37.57, 126.98, "Asia/Seoul"],
  ["Tokyo", 35.68, 139.69, "Asia/Tokyo"], ["Perth", -31.95, 115.86, "Australia/Perth"],
  ["Adelaide", -34.93, 138.60, "Australia/Adelaide"], ["Brisbane", -27.47, 153.03, "Australia/Brisbane"],
  ["Melbourne", -37.81, 144.96, "Australia/Melbourne"], ["Sydney", -33.87, 151.21, "Australia/Sydney"],
  ["Auckland", -36.85, 174.76, "Pacific/Auckland"]
];
function cityByName(name) {
  var c = CITIES.filter(function(c) { return c[0] === name; })[0];
  return { name: c[0], latitude: c[1], longitude: c[2], zone: c[3] };
}

// The clocks: yours first, from your browser's time zone (named after the first city in the list with that zone, or
// after the zone: "Europe/Vilnius" is Vilnius), then New York, London and Tokyo; when one of them is yours, Sydney
// takes its place
var ownZone = Intl.DateTimeFormat().resolvedOptions().timeZone;
// the zone as the list names it: some browsers still report older names of a few zones
var ownZoneNow = { "Europe/Kiev": "Europe/Kyiv", "Asia/Calcutta": "Asia/Kolkata", "Asia/Saigon": "Asia/Ho_Chi_Minh",
  "America/Buenos_Aires": "America/Argentina/Buenos_Aires" }[ownZone] || ownZone;
var ownEntry = CITIES.filter(function(c) { return c[3] === ownZoneNow; })[0];
var cities = [{
  name: ownEntry ? ownEntry[0] : ownZone.split("/").pop().replace(/_/g, " "),
  latitude: ownEntry ? ownEntry[1] : undefined, // a city the list doesn't have gets no dot on the map
  longitude: ownEntry ? ownEntry[2] : undefined,
  zone: ownZone // the browser's own name for it, which it surely knows
}];
["New York", "London", "Tokyo", "Sydney"].forEach(function(name) {
  if (cities.length < 4 && cityByName(name).zone !== ownZoneNow) {
    cities.push(cityByName(name));
  }
});

// How the clocks show (the page's controls change these)
var nightFaces = true; // a dark face while it is night in the city, from 6 pm to 6 am
var digits = "auto";   // the time in digits: "auto" (the way your browser writes times), "12", "24" or "off"
var showMap = false;   // a map of the cities under the clocks: true shows it (never on a narrow screen)
var secondHandMove = "tick"; // the second hand: "tick" (a step each second), "smooth" (round without stopping) or "off"

// a color for each clock: its rim, and its city's dot on the map
var colors = am5.ColorSet.new(root, {});

// The clocks on top, in a grid: four in a row, or two rows of two on a narrow screen; the map under them (layoutClocks,
// below, sizes both)
// https://docs.amcharts.com/v5/concepts/common-elements/containers/#layout
root.container.set("layout", root.verticalLayout);
var clockGrid = root.container.children.push(am5.Container.new(root, {
  width: am5.p100,
  layout: root.gridLayout
}));

// Create the map chart: the world as a grid of dots, under the clocks
// https://docs.amcharts.com/v5/charts/map-chart/
var map = root.container.children.push(am5map.MapChart.new(root, {
  width: am5.p100,
  projection: am5map.geoEquirectangular(),
  panX: "none",     // the map stays put: no dragging...
  panY: "none",
  wheelY: "none",   // ...no zooming with the mouse wheel...
  pinchZoom: false, // ...or with two fingers
  paddingTop: 0,
  paddingBottom: 20
}));

// The land as dots: a pixel series draws each country as a grid of round pixels
var land = map.series.push(am5map.PixelMapSeries.new(root, {
  geoJSON: am5geodata_worldLow,
  exclude: ["AQ"],    // no Antarctica
  pixelType: "circle",
  step: 2,            // a dot every 2 degrees...
  pixelSize: 0.7,     // ...70% of the step wide, so there is a gap between them
  uniform: true       // an even grid of same-size dots, like a pixel image
}));
land.mapPolygons.template.setAll({
  fill: root.interfaceColors.get("alternativeBackground"),
  fillOpacity: 0.16 // faint, so the cities stand out
});

// The cities: a dot in each clock's color
// https://docs.amcharts.com/v5/charts/map-chart/map-point-series/
var places = map.series.push(am5map.MapPointSeries.new(root, {}));
places.bullets.push(function(root, series, dataItem) {
  var place = dataItem.dataContext;
  if (place.latitude === undefined) {
    return; // a city this demo doesn't know the place of: its clock only
  }
  return am5.Bullet.new(root, {
    sprite: am5.Circle.new(root, {
      radius: place.radius,
      fill: place.color,
      stroke: root.interfaceColors.get("background"), // a ring in the background's color around it
      strokeWidth: 2,
      tooltipText: place.name
    })
  });
});

// A city's wall clock time as a date whose hours and minutes are that city's: the browser converts the moment to the
// time zone, so there is no time zone data to keep up to date
function wallTime(date, zone) {
  return new Date(date.toLocaleString("en-US", { timeZone: zone }));
}

// the dots' size follows the map's (layoutClocks sets it)
var placeRadius = 6;

// One clock: an analog clock made from a gauge, with the city's name, its time in digits and how far it is from
// yours underneath
function makeClock(city, index) {
  var color = colors.getIndex(index * 3); // every third theme color, so the four differ more

  // a column of the grid (its size is set by layoutClocks), and in its middle the clock with its three lines of text
  var column = clockGrid.children.push(am5.Container.new(root, {}));
  var group = column.children.push(am5.Container.new(root, {
    layout: root.verticalLayout,
    width: am5.p100,
    y: am5.p50,       // in the middle of the column...
    centerY: am5.p50  // ...up and down
  }));

  // Create chart
  // https://docs.amcharts.com/v5/charts/radar-chart/
  var chart = group.children.push(am5radar.RadarChart.new(root, {
    panX: false, // the clocks don't pan when dragged
    panY: false,
    radius: am5.percent(92), // the dial fills most of its square...
    paddingTop: 0,           // ...with no padding around it, so the text sits right under it
    paddingBottom: 0,
    paddingLeft: 0,
    paddingRight: 0
  }));

  // the face: a circle behind the dial, dark at night (see paint)
  var face = chart.radarContainer.children.unshift(am5.Circle.new(root, {
    fill: am5.color(0x1b2033),
    fillOpacity: 0
  }));

  // Create axis and its renderer
  // https://docs.amcharts.com/v5/charts/radar-chart/gauge-charts/#axes
  // (the sizes in pixels here and on the hands are set again for the clock's size, in resize)
  var axisRenderer = am5radar.AxisRendererCircular.new(root, {
    innerRadius: -8,  // the hour marks are 8px in from the rim
    strokeOpacity: 1, // a solid rim...
    strokeWidth: 5,   // ...5px thick...
    stroke: color,    // ...in the clock's color, as its city's dot on the map
    minGridDistance: 10 // all twelve numbers, even on a small clock
  });

  var xAxis = chart.xAxes.push(am5xy.ValueAxis.new(root, {
    maxDeviation: 0,    // the scale can't be panned past its ends
    min: 0,             // the dial runs from 0...
    max: 12,            // ...to 12 hours
    strictMinMax: true, // exactly, not rounded out
    renderer: axisRenderer,
    maxPrecision: 0     // whole numbers only
  }));

  axisRenderer.labels.template.setAll({
    minPosition: 0.02,  // no 0 next to the 12
    textType: "adjusted", // upright numbers, each centered on its point around the dial
    inside: true,       // inside the rim...
    radius: 18          // ...18px in from it
  });
  axisRenderer.grid.template.set("strokeOpacity", 1); // solid hour marks

  // Add clock hands
  // https://docs.amcharts.com/v5/charts/radar-chart/gauge-charts/#clock-hands
  // each hand is the bullet of an axis range: setting the range's value turns the hand
  function makeHand(radius, width, pinRadius) {
    var dataItem = xAxis.makeDataItem({});
    var hand = am5radar.ClockHand.new(root, {
      radius: am5.percent(radius),
      topWidth: width,    // as wide at the tip...
      bottomWidth: width, // ...as at the pin
      pinRadius: pinRadius,
      layer: 5            // drawn on a layer above the rest of the chart
    });
    dataItem.set("bullet", am5xy.AxisBullet.new(root, { sprite: hand }));
    xAxis.createAxisRange(dataItem);
    dataItem.get("grid").set("visible", false); // hide the range's own grid line
    return { dataItem: dataItem, hand: hand };
  }
  var hourHand = makeHand(50, 8, 6);   // short and wide
  var minuteHand = makeHand(78, 5, 5); // long and thinner
  var secondHand = makeHand(80, 2, 3); // long and thin...
  secondHand.hand.hand.set("fill", root.interfaceColors.get("negative")); // ...in the theme's red
  secondHand.hand.pin.set("fill", root.interfaceColors.get("negative"));
  secondHand.hand.set("forceHidden", secondHandMove === "off");

  // the city's name, the time in digits and how far it is from yours (their sizes follow the clock's, see layoutClocks)
  var nameLabel = group.children.push(am5.Label.new(root, {
    text: city.name,
    fontWeight: "600",
    x: am5.p50,       // centered...
    centerX: am5.p50, // ...under the clock
    paddingBottom: 0
  }));
  var timeLabel = group.children.push(am5.Label.new(root, {
    x: am5.p50,
    centerX: am5.p50,
    paddingTop: 0,
    paddingBottom: 0
  }));
  var offsetLabel = group.children.push(am5.Label.new(root, {
    fillOpacity: 0.7, // quieter than the time
    x: am5.p50,
    centerX: am5.p50,
    paddingTop: 2
  }));

  // the city's dot on the map, the clock's place in the point series' data
  function placeCity() {
    var place = {
      name: city.name,
      latitude: city.latitude,
      longitude: city.longitude,
      color: color,
      radius: placeRadius
    };
    if (index < places.data.length) {
      places.data.setIndex(index, place);
    } else {
      places.data.push(place);
    }
  }
  placeCity();

  // the face's size follows the dial's: the chart works it out when it draws
  root.events.on("frameended", function() {
    var radius = chart.getPrivate("radius", 0);
    if (face.get("radius") !== radius) {
      face.set("radius", radius);
    }
  });

  // Day and night colors: on a dark face the numbers, marks and hands turn white; by day they take the theme's
  var night = null;
  function paint(isNight) {
    night = isNight;
    var ic = root.interfaceColors;
    var white = am5.color(0xffffff);
    face.set("fillOpacity", isNight ? 1 : 0);
    axisRenderer.labels.template.set("fill", isNight ? white : ic.get("text"));
    axisRenderer.grid.template.set("stroke", isNight ? white : ic.get("grid"));
    [hourHand, minuteHand].forEach(function(h) {
      h.hand.hand.set("fill", isNight ? white : ic.get("alternativeBackground"));
      h.hand.pin.set("fill", isNight ? white : ic.get("alternativeBackground"));
    });
  }

  // Point the hands at the city's time, and write it out; duration is the second hand's step when it ticks
  function update(duration) {
    var now = new Date();
    var time = wallTime(now, city.zone);
    var hours = time.getHours();
    var minutes = time.getMinutes();
    var seconds = time.getSeconds();
    // all hands sit on the 12-hour axis, so minutes and seconds are scaled to 0-12
    hourHand.dataItem.set("value", hours % 12 + minutes / 60 + seconds / 3600);
    minuteHand.dataItem.set("value", 12 * (minutes + seconds / 60) / 60);
    if (secondHandMove === "tick") { // ("smooth" moves it on every frame: see the end of the code)
      var from = secondHand.dataItem.get("value", 0);
      var to = 12 * seconds / 60;
      if (to == 0) {
        to = 11.999; // the hand ends at 12 instead of running back to 0...
      }
      if (from > 11.99) {
        from = 0;    // ...and starts again from 0
      }
      if (Math.abs(to - from) > 0.25) {
        // more than a second's step away (0.2 on the 0-12 axis): the page was in the background, or the computer
        // asleep. The hand goes straight there, rather than racing round, or even back
        duration = 0;
      }
      secondHand.dataItem.animate({ key: "value", from: from, to: to, duration: duration });
    }

    var isNight = nightFaces && (hours < 6 || hours >= 18);
    if (isNight !== night) {
      paint(isNight);
    }

    // the time in digits, in your browser's way of writing times unless the 12 or 24 hour clock is chosen
    timeLabel.set("forceHidden", digits === "off");
    var options = { hour: "numeric", minute: "2-digit", timeZone: city.zone };
    if (digits === "12" || digits === "24") {
      options.hour12 = digits === "12";
    }
    timeLabel.set("text", new Intl.DateTimeFormat(undefined, options).format(now));

    // how far ahead or behind your own time, in hours and minutes, and whether it is already tomorrow there
    var own = wallTime(now, ownZone);
    var diff = Math.round((time - own) / 60000); // minutes
    var text = "Your time";
    if (city.zone !== ownZone && city.zone !== ownZoneNow) {
      var h = Math.floor(Math.abs(diff) / 60);
      var m = Math.abs(diff) % 60;
      text = diff == 0 ? "Same time" :
        h + (m ? ":" + (m < 10 ? "0" : "") + m : "") + (h == 1 && !m ? " hour " : " hours ") + (diff > 0 ? "ahead" : "behind");
      if (time.getDate() != own.getDate()) {
        text += diff > 0 ? ", tomorrow" : ", yesterday";
      }
    }
    offsetLabel.set("text", text);
  }

  update(0); // the hands in place at once
  chart.appear(1000, 100); // animate on load
  // Sizes that follow the clock's (layoutClocks gives it): the text under it, so it reads from across a room on a TV,
  // the numbers, the marks, the rim and the hands, with floors for small screens
  function resize(size) {
    chart.set("height", size);
    nameLabel.set("fontSize", Math.max(12, size * 0.09));
    timeLabel.set("fontSize", Math.max(15, size * 0.13));
    offsetLabel.set("fontSize", Math.max(10, size * 0.065));
    axisRenderer.labels.template.setAll({ fontSize: Math.max(10, size * 0.075), radius: Math.max(14, size * 0.1) });
    axisRenderer.setAll({ strokeWidth: Math.max(3, size * 0.025), innerRadius: -Math.max(6, size * 0.04) });
    hourHand.hand.setAll({ topWidth: Math.max(5, size * 0.045), bottomWidth: Math.max(5, size * 0.045), pinRadius: Math.max(4, size * 0.033) });
    minuteHand.hand.setAll({ topWidth: Math.max(3, size * 0.028), bottomWidth: Math.max(3, size * 0.028), pinRadius: Math.max(3, size * 0.028) });
  }

  return {
    column: column,
    nameLabel: nameLabel,
    resize: resize,
    update: update,
    placeCity: placeCity,
    secondHand: secondHand.hand,
    // the second hand at a point of the minute, on the 0-12 axis
    sweep: function(value) {
      secondHand.dataItem.set("value", value);
    },
    repaint: function() { night = null; },
    // another city on this clock: its name, its dot on the map, and the hands and text at its time at once
    setCity: function(newCity) {
      city = newCity;
      nameLabel.set("text", city.name);
      placeCity();
      night = null;
      update(0);
    }
  };
}

var clocks = cities.map(makeClock);

// Four in a row with the map under them, or two rows of two without it when the chart is narrower than 600px. Each
// clock and its text fill their column together, with at least 16px above and below: the three lines of text take
// about 0.38 of the clock's size. The clocks take up to 60% of the height when the map shows; it gets the rest
function layoutClocks() {
  var width = root.container.width();
  var height = root.container.height();
  var narrow = width < 600;
  var mapShown = showMap && !narrow;
  var columnWidth = width / (narrow ? 2 : 4);
  var columnHeight = (mapShown ? height * 0.6 : height) / (narrow ? 2 : 1);
  var size = Math.max(60, Math.min(columnWidth * 0.9, (columnHeight - 32) / 1.38));
  var gridHeight = mapShown ? Math.min(columnHeight, size * 1.38 + 32) : height;
  clockGrid.set("height", gridHeight);
  map.setAll({
    forceHidden: !mapShown,
    height: Math.max(0, height - gridHeight)
  });
  clocks.forEach(function(clock) {
    clock.column.setAll({
      width: am5.percent(narrow ? 50 : 25),
      height: am5.percent(narrow ? 50 : 100)
    });
    clock.resize(size);
  });
  // the cities' dots grow with the map
  var radius = Math.round(Math.max(5, (height - gridHeight) * 0.02));
  if (radius !== placeRadius) {
    placeRadius = radius;
    clocks.forEach(function(clock) {
      clock.placeCity();
    });
  }
}
root.container.events.on("boundschanged", layoutClocks);
layoutClocks();

// animate the map on load
map.appear(1000, 100);

// move the hands every second
setInterval(function() {
  clocks.forEach(function(clock) {
    clock.update(300); // the second hand takes 0.3 seconds to step
  });
}, 1000);

// "smooth": the second hands move on every frame the chart draws, to the millisecond. Moving them makes the chart draw
// the next frame too, so they keep going until secondHandMove changes. The seconds are the same in every time zone
root.events.on("frameended", function() {
  if (secondHandMove === "smooth") {
    var now = new Date();
    var value = 12 * (now.getSeconds() + now.getMilliseconds() / 1000) / 60; // on the 0-12 axis, from 0 up to just under 12
    clocks.forEach(function(clock) {
      clock.sweep(value);
    });
  }
});

// Set the hands straight away when the page is shown again: timers slow down in a background tab
function onVisibilityChange() {
  if (root.isDisposed()) {
    // the chart is gone: stop listening
    document.removeEventListener("visibilitychange", onVisibilityChange);
  } else {
    clocks.forEach(function(clock) {
      clock.update(0);
    });
  }
}
document.addEventListener("visibilitychange", onVisibilityChange);