Dojo projects with charts
Built with amCharts Charts.
Interactive tools and experiments from the DataViz Dojo — all powered by amCharts 5 Charts.
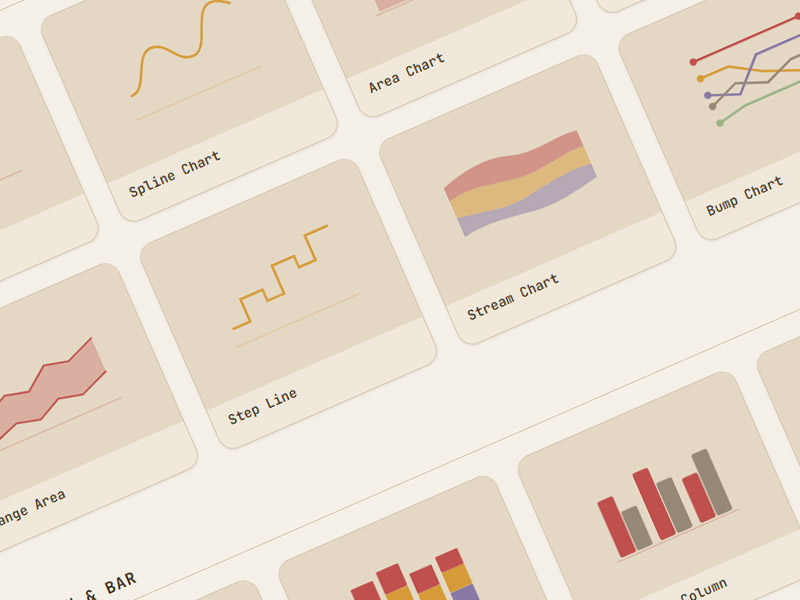
Chart Types
An interactive catalog of 63 chart types built with amCharts 5. Browse by category, view schematic and real-data examples, inspect the code, and export to CodePen.
Browse
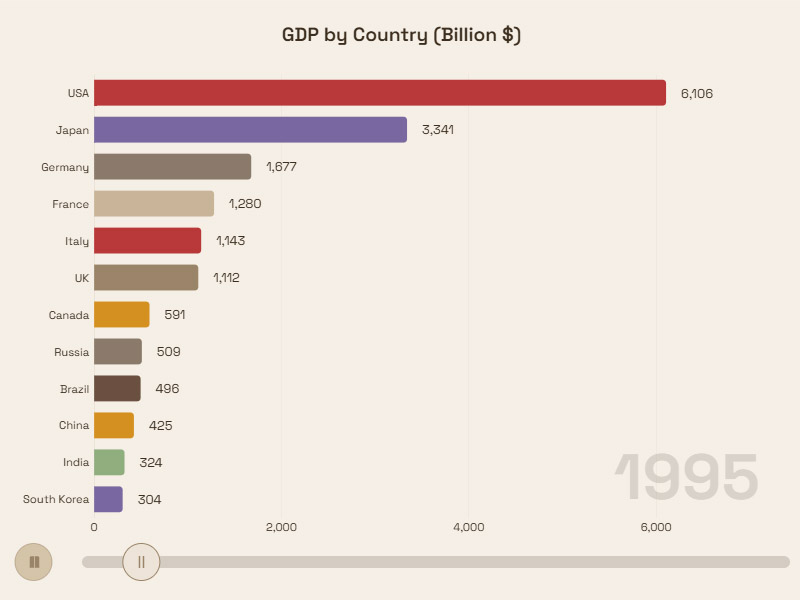
Chart Race Generator
Create animated chart races from your own data. Supports 7 chart types — bar, column, pie, radar, treemap, packed bubble, and voronoi. Customize and export as HTML.
Create