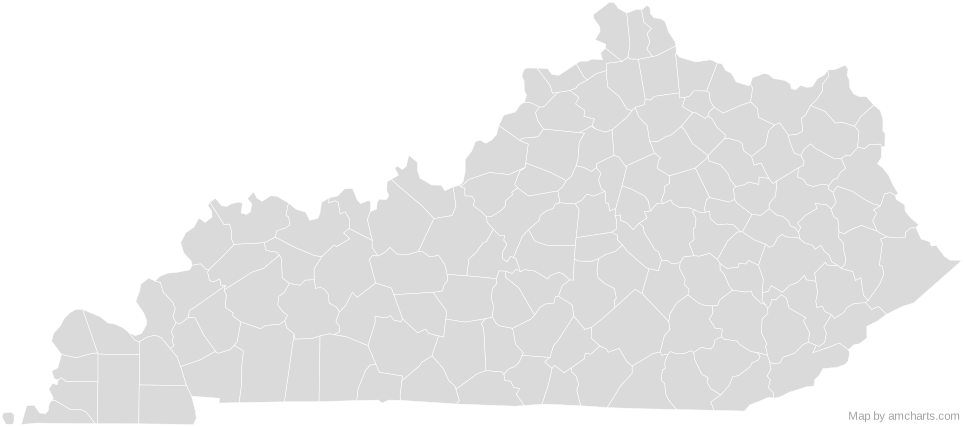
Free Kentucky Counties SVG map with 120 counties, in Mercator projection, high and low detail.
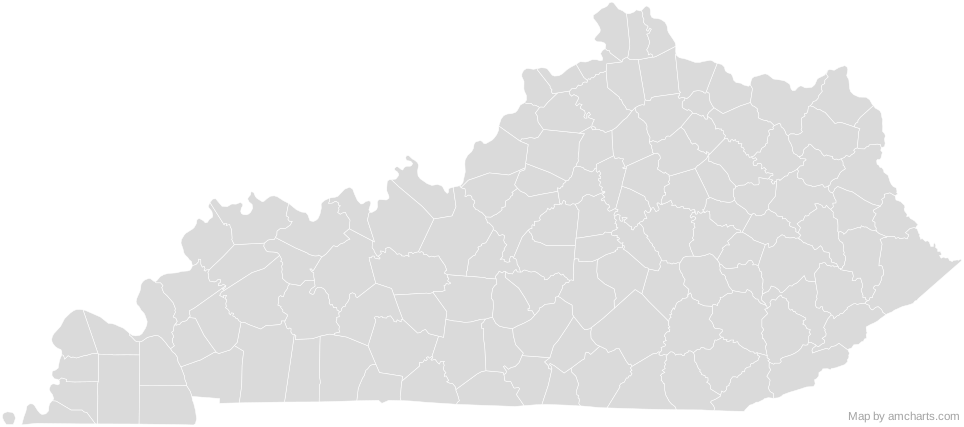
Free for any use, commercial projects included, as long as you keep the amCharts credit (CC BY 4.0).
All 427 maps, no credit needed: $99 Every SVG map in one ZIP, royalty-free, with updates.210012100321005210072100921011210132101521017210192102121023210252102721029210312103321035210372103921041210432104521047210492105121053210552105721059210612106321065210672106921071210732107521077210792108121083210852108721089210912109321095210972109921101211032110521107211092111121113211152111721119211212112321125211272112921131211332113521137211392114121143211512115321155211572115921161211452114721149211632116521167211692117121173211752117721179211812118321185211872118921191211932119521197211992120121203212052120721209212112121321215212172121921221212232122521227212292123121233212352123721239No region matches that.
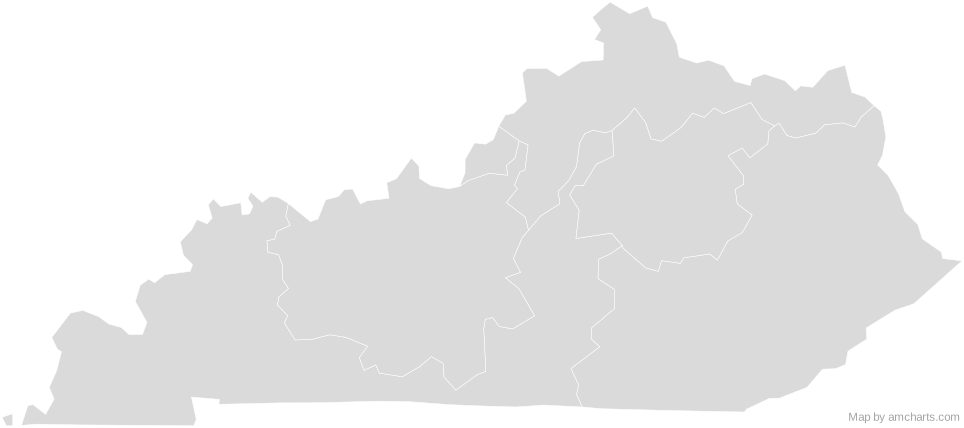
The same map ships with the amCharts 5 library as am5geodata_region_usa_kyLow, ready for zoom, tooltips, heat maps and drill-downs. See JavaScript Maps.
import am5geodata from "@amcharts/amcharts5-geodata/region/usa/kyLow";
chart.series.push(
am5map.MapPolygonSeries.new(root, {
geoJSON: am5geodata
})
);Yes, for free, as long as you keep the amCharts credit (CC BY 4.0). To use maps without the credit, get the SVG Maps pack: all 427 maps for $99, one payment.
Mercator, fitted to the map's own bounds. For Equal Earth, Albers, orthographic and others, use the SVG Map Generator.
Each region is its own <path> with an id (the ISO code where one exists) and a data-name, so you can style or script it directly.
Yes. It is plain SVG: no scripts, fonts or external references.