Multiple Panels
Our Stock chart can support any number of stock panels. And you can even add or remove them at run time. You can use one panel to show price change and another – volume change. More panels can be added for technical indicators and other technical analysis. Each Stock Panel can have any number of graphs. Each Stock Panel is a separate serial chart and is based on AmSerialChart and so it can do anything this chart can.
Intelligent date-placing algorithm
Try to zoom out this chart – you will see that the grid lines are placed at the beginning of the months (they will always show the first day of the month), at the place where new year started, the date format is different – instead of the month name you can see the year number. You can modify date formats in any way you need and set a different date format for each period. Try to scroll the chart – you will see that the dates are always kept the same, they do not fluctuate and scrolling is done smoothly.
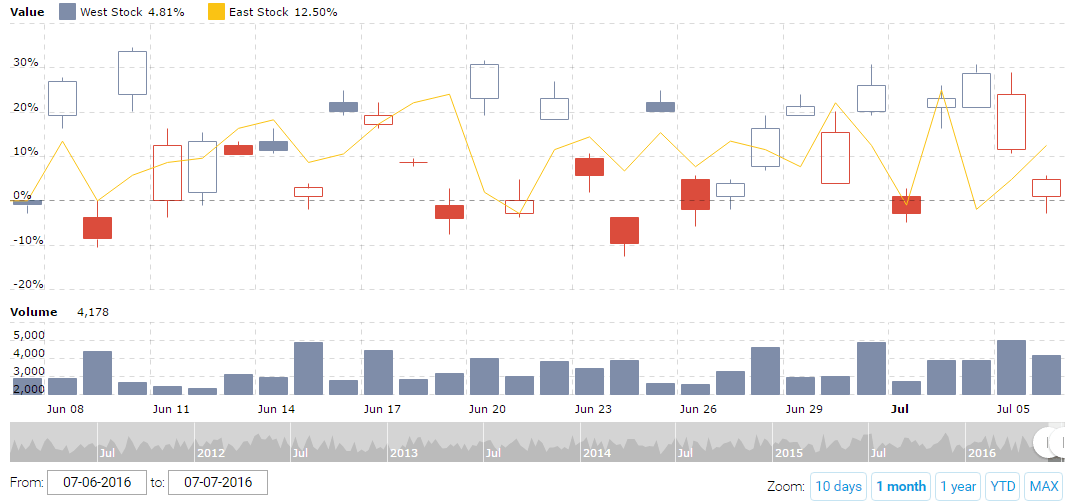
Professional Candlesticks
Stock market professionals are used to analyse stocks using a bit different candlesticks than the ones most of us know. The above chart illustrates this kind of candlesticks. The main difference is this – empty candle is shown when open value of the same date is bigger than close value (price dropped during the single period – day, week, month, etc.). And the color indicates if price dropped or risen comparing to a previous period – if current item’s close price is lower than previous period close price, the candle will be red. Otherwise – blue (or some other colors, you are free to choose). To enable this feature, you must simply set proCandlesticks property of a graph to true.
Demo source