Pie Chart with Broken Down Slices
Drilling down from a high-level overview to more details is one of the main advantages of interactive data visualizations. This demo shows you one such scenario utilizing a pie chart. Click on one of the slices to see it in action.
Key implementation details
The trick here is that we just change the underlying data of the series when the user clicks on a slice. For the selected slice we replace it with data for sub-slices.
Related tutorials
Build this chart with AI
The prompt below can be used to build this chart with AI. For best coding results, use the most advanced AI models, like Claude Opus 4.6 and GPT-5.3-Codex. For more info and tips, check out amCharts AI docs.
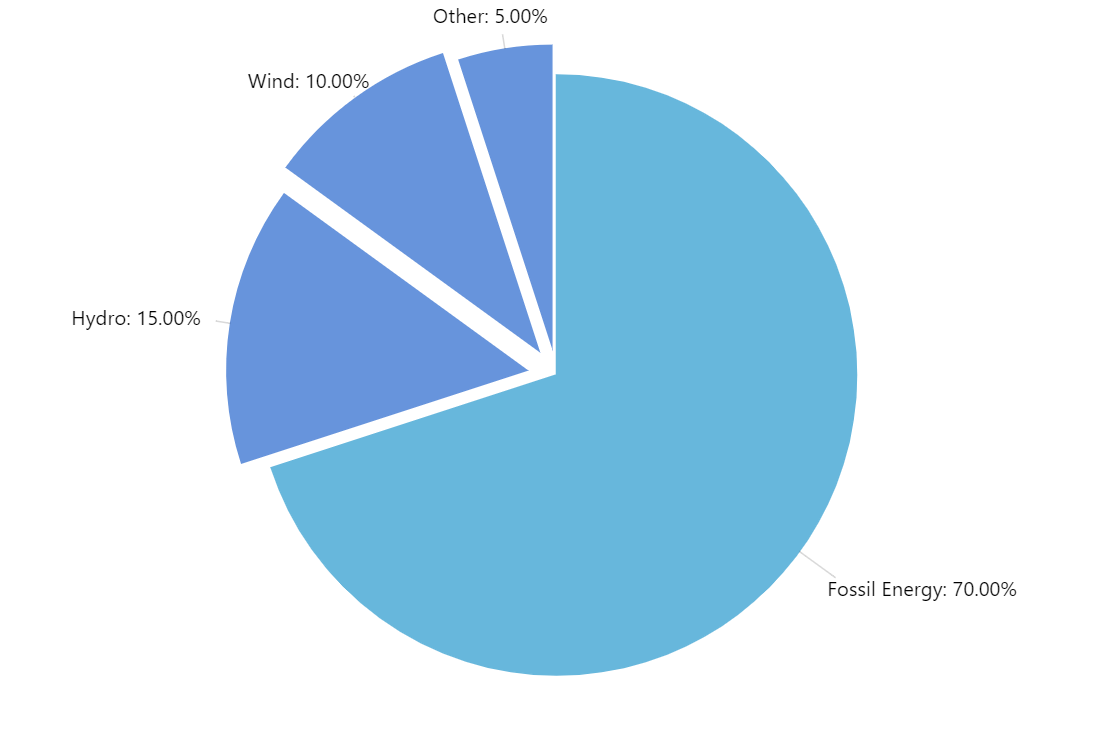
Create an interactive pie chart with drill-down capability showing hierarchical energy data. The top level displays two categories: 'Fossil Energy' (70%) and 'Green Energy' (30%). Clicking a slice replaces it with its sub-categories while keeping other parent slices intact. Fossil Energy breaks into Oil (15%), Coal (35%), Nuclear (20%); Green Energy breaks into Hydro (15%), Wind (10%), Other (5%). Labels should be positioned near slice centers. Include smooth animated transitions when drilling down. The chart should fill 100% width at 500px height. Use amCharts 5 library.
Demo source