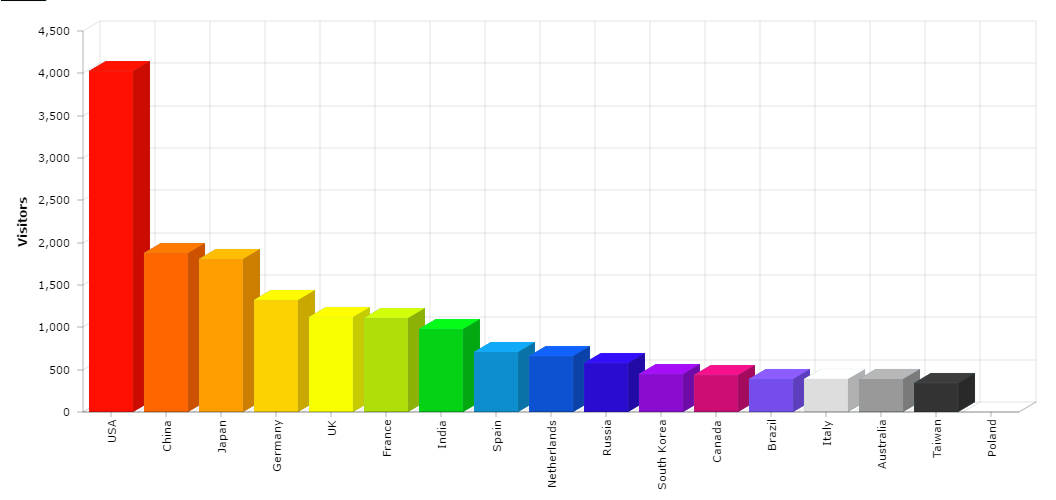
3D Column Chart
Columns and bars in our charts can have a 3D look. You can adjust depth and angle to make them more deep – click EDIT button and play with depth3D and angle properties.
Hidden Chart Cursor adds a better user experience
If you check the source of this sample, you will notice that it has a ChartCursor added. Although it is invisible and zooming is disabled (as we don’t need to zoom this chart). We added it for another reason – when you move the mouse over the plot area, the balloon is displayed next to the most close column, even if you are not hovering directly over it. This makes it easier for your users to check real value of the column. We especially recommend using this trick with line graphs – without cursor, you would need to roll-over relatively small bullet to see the balloon, and with cursor you just move the mouse over plot area.
Demo source