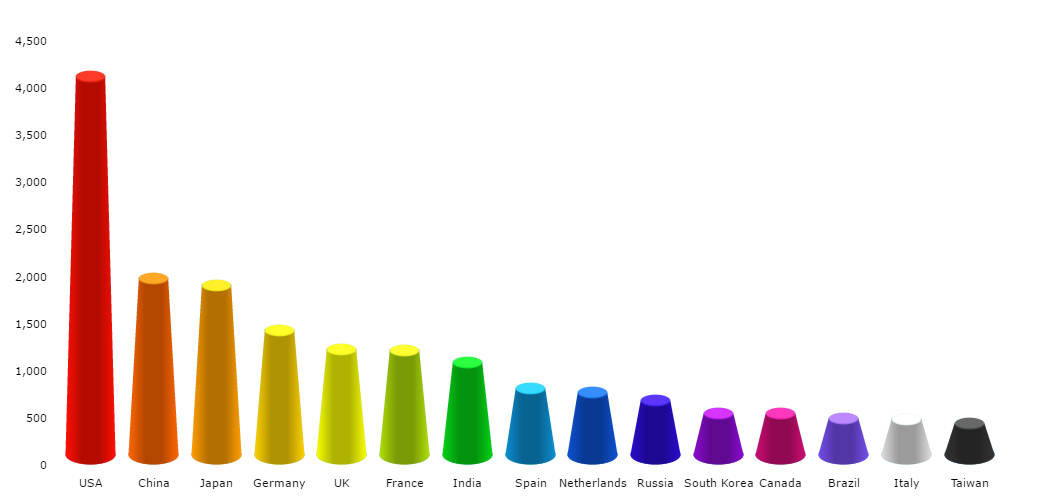
3D Cylinder Chart
Columns and bars in our charts can look like cylinders or even cones. To achieve this, you should set topRadiusproperty of a graph to 0 – 1.5 value. You can adjust depth and angle to make them more deep – click EDIT button and play with depth3D and angle properties.
Demo source