Area With Time Based Data
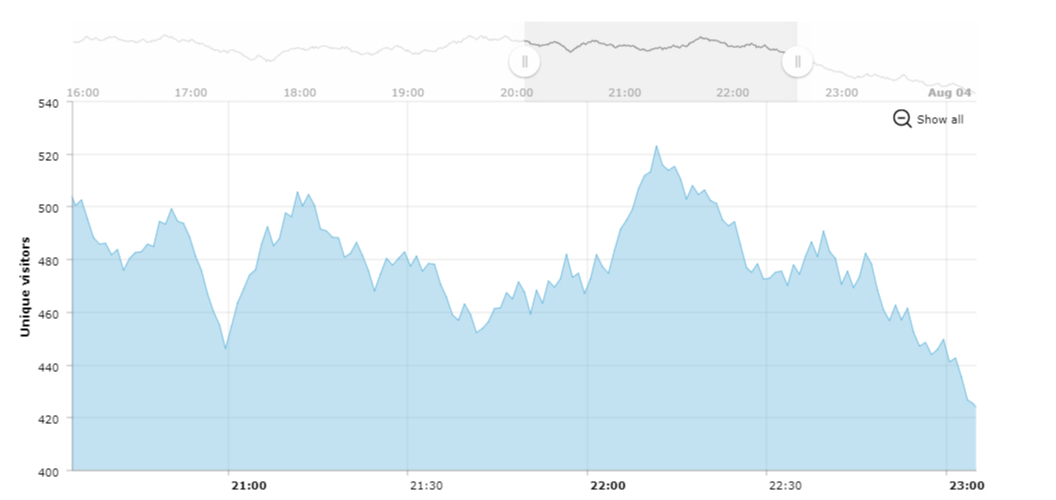
Our serial chart can accept data as date strings, date objects or time stamps. Your data can be at any interval you need – this particular chart displays data which changes each minute. You are free to format time strings on the axis and in the category tool-tip in any way you want. The beginning of a period change can be marked as bold and use a different date/time format.
Zooming the chart from outside
You can easily zoom-in the chart to desired dates/categories/indices using methods provided by our charting API. You can do it one some user interaction or when chart is rendered.
Demo source