Fill between two lines
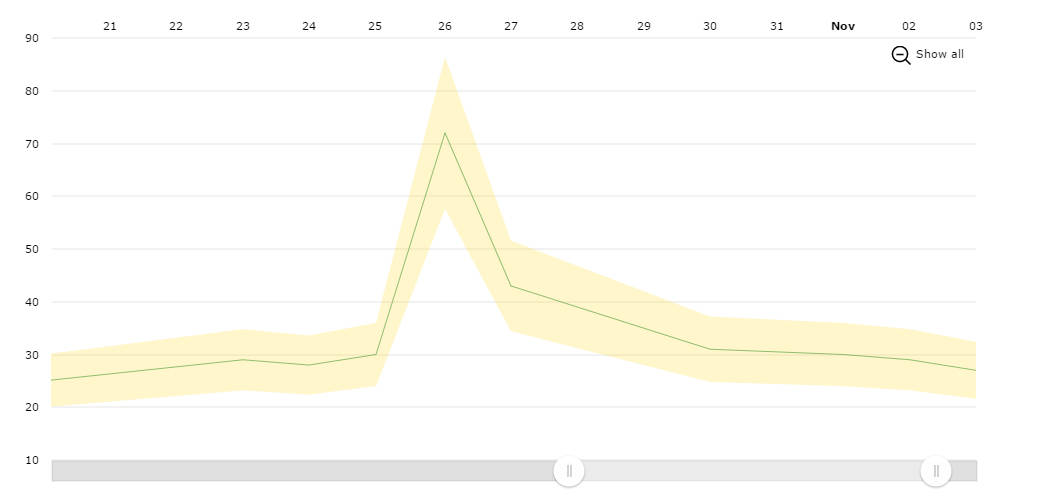
You can fill the area between two graphs and create a range or difference chart. Instead of line graph, you can also use smoothed or step line graph here. Usually charts like these indicate the allowed value fluctuation and how the real data meets it.
Fills with patterns
If you click the “patterns” theme button on top of the chart, you will see that the graphs can be filled with patterns instead of colors. We provide several patterns in our package or you can create and use your own.
Demo source