Date Based Data
Our serial chart can accept data as date strings, date objects or time stamps. Dates on category axis are placed at logical intervals using any date format you want. Period beginning can be marked as bold and use a different date format. Your data can be yearly, monthly, daily, hourly, up to milliseconds – the chart will handle any time span. The chart can be zoomed-in or panned, Chart scrollbar can shows a rough graph of all your data and you can use it both to scroll or to zoom the chart to desired position.
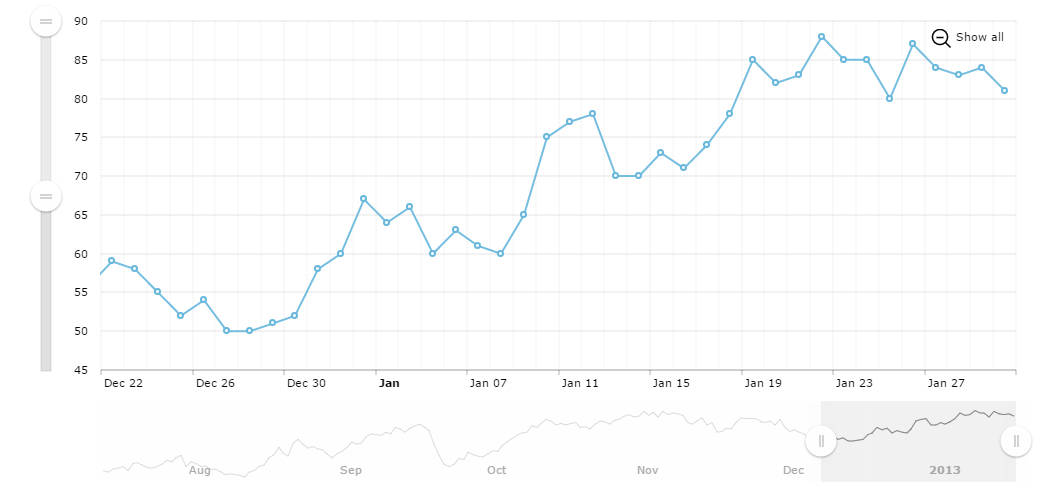
Hidden bullets
If you zoom-in the chart to a smaller time span, you will notice that the bullets are displayed. When zooming-out at some point bullets are hidden. This is done to avoid a messy look. You can configure this using hideBulletsCount property of the graph.
Chart Scrollbar with a graph inside
In the bottom (it can also be on the top) of the chart you have a chart scrollbar which can be used to zoom-in or zoom-out the chart. This scrollbar can be just a simple one or have a graph inside it to show a rough view of how data changed over the whole period of the data available.
Zoomable Value Axis
Besides category axis, value axis can also be zoomable – both using vertical scrollbar and cursor. In this demo value-zooming with cursor is not enabled, as we recommend using it for one direction zooming only.
Demo source