Line Chart with Scroll and Zoom
All our serial charts (and actually XY chart too) can be zoomed-in, scrolled and panned. All you have to do is add a scrollbar to the chart. This is one of the most important features of charts, especially when dealing with large data sets.
Right approach to zooming
When displaying a zoomed-in chart we do recalculate min/max of the selected period (although you can disable this if you want) and we draw a graph of only selected period. This feature allows you to understand the data of selected period easily, solves performance issues. A lot of charting libraries simply draw one big image and then the scrolling is done by simply moving this image. This is very wrong approach in most cases, as a) performance is poor b) imagine – you have daily data of let’s say 5 years and your values increased a lot during this time. If min/max of zoomed-in period is not recalculated, when zoomed to early periods, you will only see some smooth line close to the axis and a lot of empty space above it. This graph won’t tell a lot for your users.
Intelligent date-placing algorithm
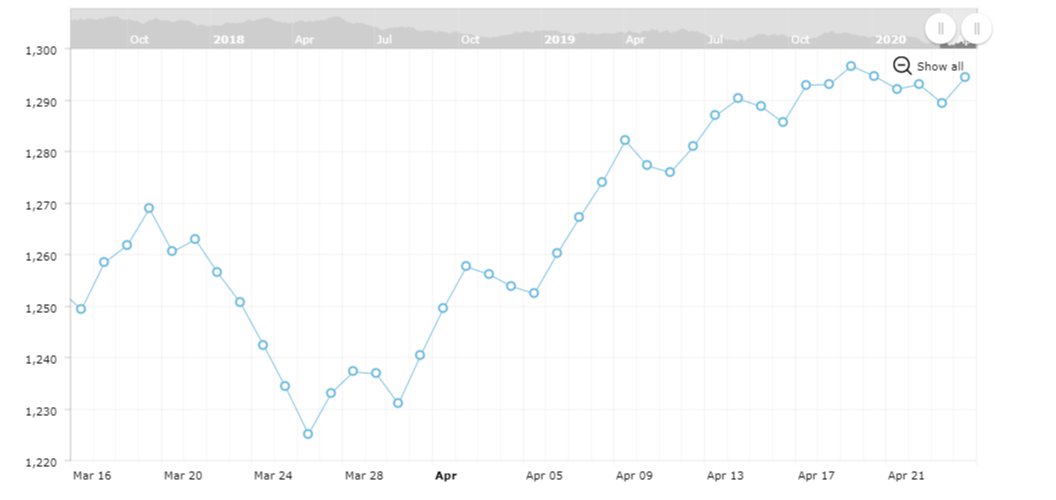
Try to zoom out this chart – you will see that the grid lines are placed at the beginning of the months (they will always show the first day of the month), at the place where new year started, the date format is different – instead of the month name you can see the year number. You can modify date formats in any way you need and set a different date format for each period. Try to scroll the chart – you will see that the dates are always kept the same, they do not fluctuate and scrolling is done smoothly. Now, go to our competitors, find a date based chart (if they have one) and try to perform all these tricks. We bet you will notice the difference.
Zooming or scrolling chart with mouse wheel
You can zoom in and out the chart with mouse wheel. If you press shift while rotating it, the chart will be scrolled. You can make it opposite – zoom if shift is pressed and scroll if it isn’t. mouseWheelZoomEnabled and mouseWheelScrollEnabled properties are responsible for this.
Our charts also supports zooming of value axis. Check this demo to see this in action.
Demo source