Duration on Value Axis
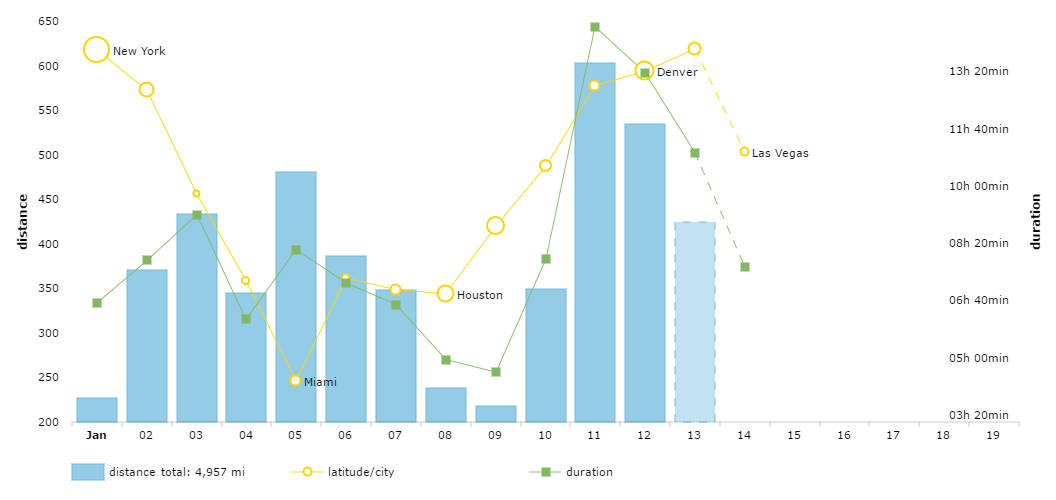
As you can see, the chart supports multiple value axes. And in this particular case one of the axes (the right one) displays duration instead of regular numbers. If you check the data (click EDIT button) you will see that the duration is passed as a simple number. It’s the axis which formats the duration in a easily readable string.
Legend can sum and display total values
The chart can accumulate the sum of the values and show it in the legend while the mouse is not hovering over any data point – total number of miles is displayed next to the distance marker in the legend.
Different bullets sizes
Bullets of the same line chart can have different sizes. You can define the size in your data file and add another dimension for your serial chart.
Demo source